UPM River Impact Analysis Results
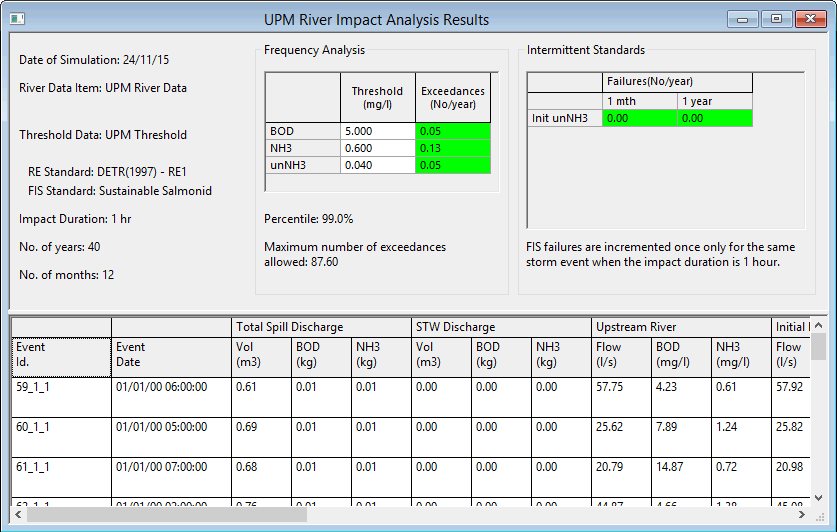
The UPM River Impact Analysis Results view displays a report containing the spills table and river impact assessment table.
The view is displayed when you click on Produce Reports on the UPM River Impact Assessment dialog.
Spill Event Settings
The block of fields in the top left-hand corner of the report show:
- The date on which the assessment was performed
- The Impact Duration, Number of Years of rainfall (as set on the UPM River Impact Assessment dialog)
- The Percentile (as set on the UPM Threshold Data dialog)
Frequency Analysis
The Frequency Analysis table shows the thresholds set for BOD, total ammonia (NH3) and un-ionised ammonia (unNH3). (See UPM Threshold Data - River Ecosystems View.) For each of these, the table shows the number of exceedances per year occurring during the test. The table cells are coloured green if the number of exceedances is acceptable or red if it is not. You can change the thresholds in the table, and the number of exceedances will be recalculated.
The maximum number of exceedances is shown at the bottom of the table.
Intermittent Standards
The Intermittent Standards table shows the number of occasions per year that concentrations of initial un-ionised ammonia (Init unNH3), downstream dissolved oxygen (DS DO) and downstream un-ionised ammonia (DS unNH3) have exceeded the values set in the Fundamental Standards view. There is one column for each Return Period selected in the UPM River Impact Assessment dialog. The table cells are coloured green if the number of failures is acceptable or red if it is not.
Results Table
The results table includes the following information:
|
Field |
Description |
|---|---|
|
Event Date |
The date and time of the event. |
|
Total Spill Discharge |
The total flow volume, BOD and ammonia discharged from all CSOs contributing to the spill, as identified in the Inflows view. |
|
STW Discharge |
The flow volume, total BOD and total ammonia discharged from the sewage treatment works, as specified in the Inflows view. |
|
Upstream River |
The river flow, BOD concentration and total ammonia concentration immediately upstream of any CSO spills, as specified in the Upstream view. |
|
Initial Mixed River |
The river flow, BOD concentration, total ammonia concentration, dissolved oxygen concentration, temperature and pH value of the river immediately after mixing with the CSO spills, as specified in the Upstream view. |
|
Initial unNH3 Failures |
Indicates whether initial concentration of un-ionised ammonia (Init unNH3) has exceeded the values set in the Fundamental Standards view. There is one column for each Return Period selected in the UPM River Impact Assessment dialog. |
|
Worst DS |
Shows the most unsatisfactory level of downstream concentration calculated for the sub-reaches. |
|
Downstream DO Failures |
Indicates whether concentration of downstream dissolved oxygen (DS DO) has exceeded the values set in the Fundamental Standards view. There is one column for each Return Period selected in the UPM River Impact Assessment dialog. |
|
Downstream unNH3 Failures |
Indicates whether concentration of downstream un-ionised ammonia (DS unNH3) has exceeded the values set in the Fundamental Standards view. There is one column for each Return Period selected in the UPM River Impact Assessment dialog. |
|
Predicted DO at End of Sub-reach |
Level of dissolved oxygen calculated for end of each sub-reach. |
|
Predicted BOD at End of Sub-reach |
Level of BOD calculated for end of each sub-reach. |
|
Predicted Total Ammonia at End of Sub-reach |
Level of total ammonia calculated for end of each sub-reach. |

UPM River Data - Upstream View
UPM River Data - Downstream View
UPM Threshold Data - River Ecosystems View
UPM Threshold Data - Fundamental Stds View
