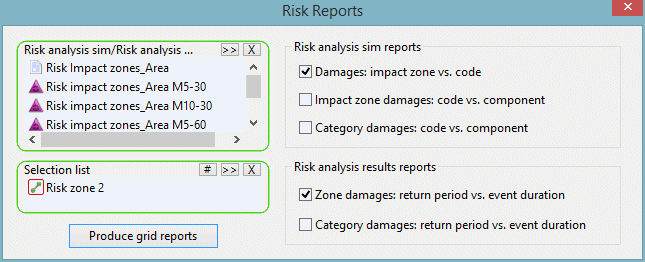
Risk Reports Dialog
The Risk Reports Dialog is used to generate grid reports from one or more Risk Analysis Runs, for a selection of Risk Impact Zones.
The dialog is displayed when Risk report is selected from the Results menu.
|
Option |
Description |
|---|---|
|
Risk analysis sim/results |
Select risk analysis simulations or results objects from which reports are to be generated:
Select a parent risk analysis run object to load all of its child risk analysis simulations and results objects. |
|
Selection List |
A Selection List can be used to restrict export of results to a selection of Risk Impact Zones. If a Selection List is not included, the results of all impact zones will be exported. Include a Selection List using one of the following methods:
|
|
Risk analysis sim reports |
Enabled when at least one risk analysis simulation object has been selected in the Risk analysis sim/results box. Select reports to be generated:
See Risk Impact Zones for further details. |
|
Risk analysis results reports |
Enabled when at least one risk analysis results object has been selected in the Risk analysis sim/results box. Select reports to be generated:
See Risk Impact Zones for further details. |
| Produce grid reports button |
Enabled when at least one report check box is enabled and ticked. Click this button to display a grid view of selected reports. |

 button.
 button
to include the objects currently selected on the GeoPlan View.