This topic examines the grid views, which give you the means to view the data for a group of objects and provides alternative editing methods, and the property sheets, which provide a way of looking at all the data for a single network object in a more structured way.

This stage assumes that you have started InfoWorks ICM and that Master database, containing the ICM Basic Tutorial, is opened in the Explorer window, showing the 'Langley Catchment Study' model group. The 'Langley Network (TUT)' should be open in the GeoPlan.
Grids
Grids are accessible either via the Grid windows option in the Window menu,
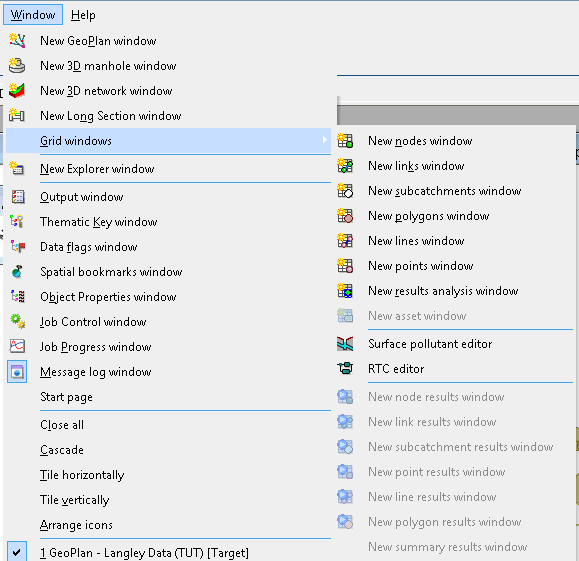
or by clicking  (Grid windows) in the Windows toolbar.
Examining grid data
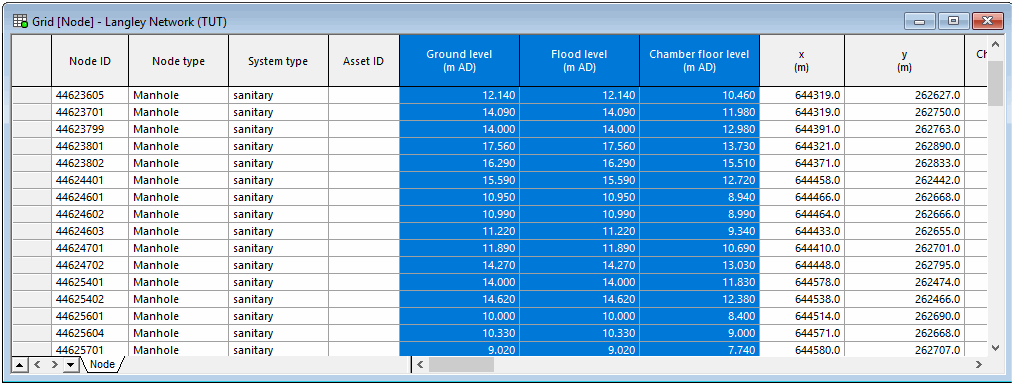
You can display a grid of all objects of one type (e.g. all nodes, all links, etc). To do so:
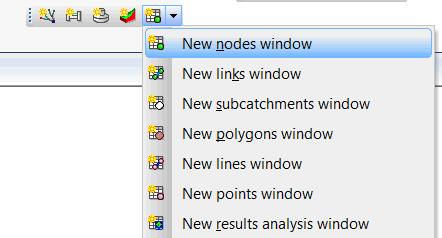
- Select the Grid windows option from the Windows menu, and then choose one of the
options in the sub-menu (for example, to view all nodes).

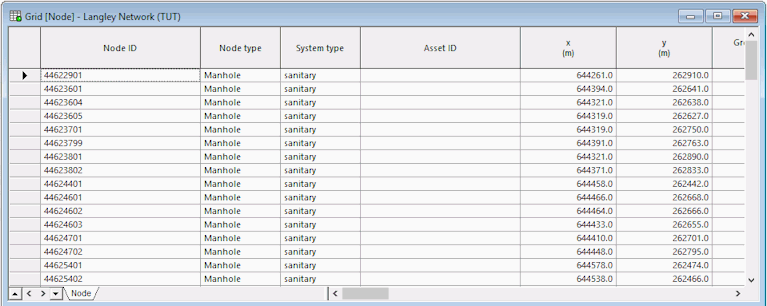
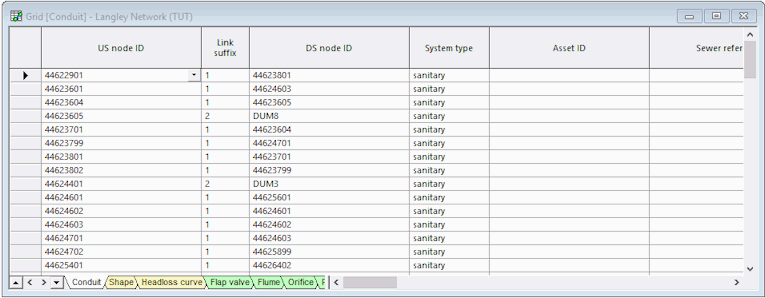
The grid view is then displayed.
- Use the scroll bars to move around the grid.
- If applicable, click the tabs at the bottom of the window
to see objects of different types (e.g. different types of links).
- Drag the corners or edges of the window to change its size and shape.
- Drag the borders between column headings to change the widths of the columns.
- Click to the left of a row to select that
object; the object is highlighted on the GeoPlan. Use Ctrl when clicking to select a number of objects; use Shift to select a group of consecutive objects.
- Click the
 button to close the grid view.
Grid manipulation
Freezing columns
To keep a column visible at all times:
- Click the column header (to select the whole column).
- Right-click the header and choose Freeze Columns from the pop-up menu.
Re-ordering columns
To change the display order of the columns:
- Change the order of columns by clicking a column header to select it and then drag the header to the left or right. You can select several columns at once by dragging the pointer over the headers.
- Click anywhere on the grid so that the columns are no longer highlighted.
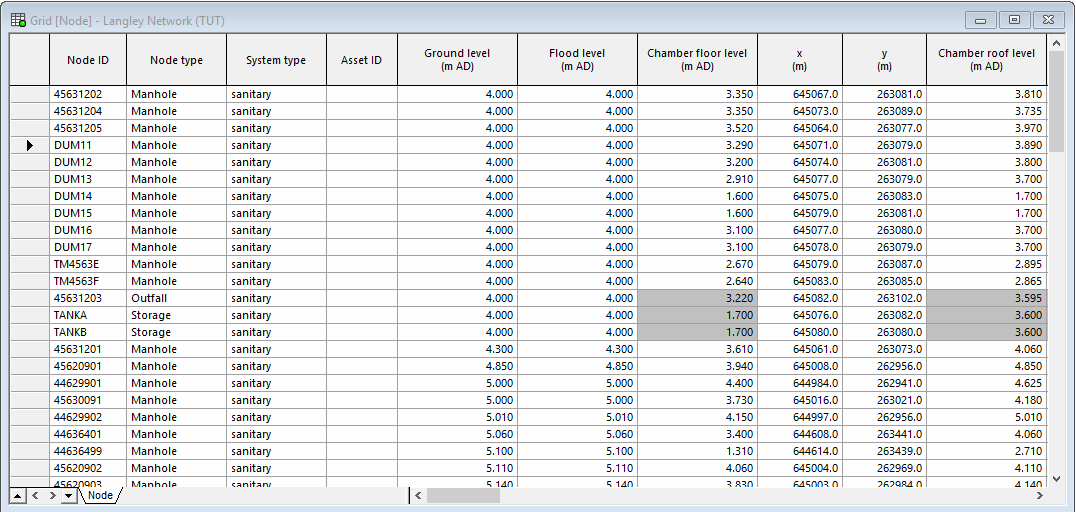
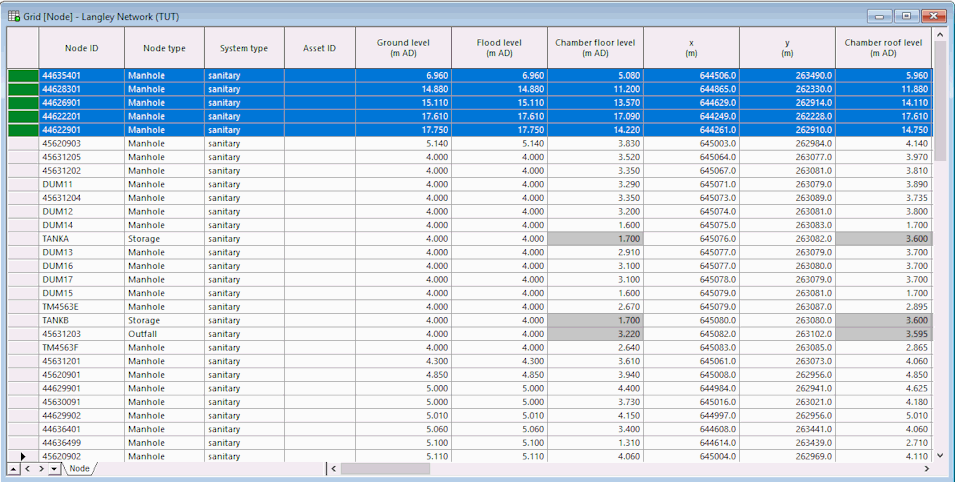
- Sort the nodes according to ground level by right-clicking the 'Ground Level' column itself (not the header) and choosing the Sort Ascending option from the pop-up menu.
- Sort by ground level and then east-west position by clicking the Ground Level column header, Ctrl-clicking the x (m) column header, right-clicking and choosing Sort on Selected Columns Ascending from the pop-up menu.
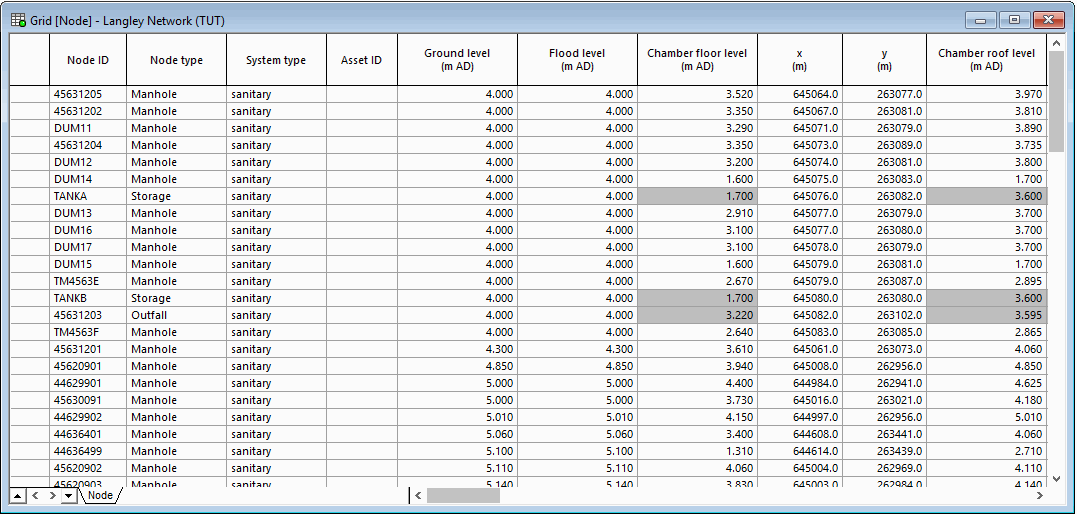
- In the GeoPlan, make a selection of nodes.
Bring the selected objects to the top of the grid (leaving the others sorted as before) by clicking the
 (Group Selections) button in the Selection toolbar.
- Click to close the grid.
Examples of grid manipulation
Finding columns
- Find a column by right-clicking any column and selecting Find column. Use the dialog to identify the column and scroll to it.
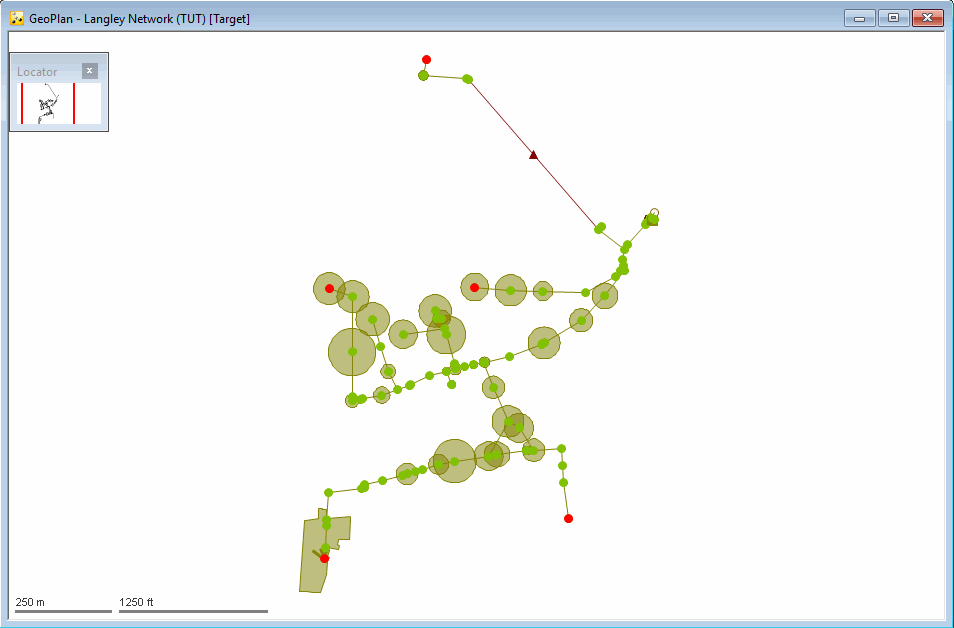
Find in the GeoPlan
The  (Find in GeoPlan) button on the GeoPlan Tools toolbar was used in another topic to select objects of a particular type. You can do the same using the relevant grid view.
- Click
 on the Selection toolbar to clear
the current selection.
on the Selection toolbar to clear
the current selection. - Right-click the GeoPlan and select Zoom to network to display the entire network.
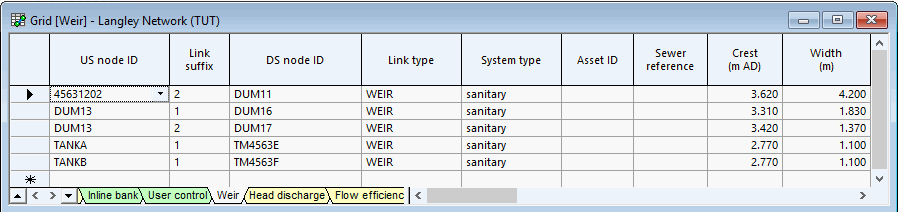
- Select Window | Grid windows | New link windows.
- Select the Weir tab (at the bottom of the dialog). .
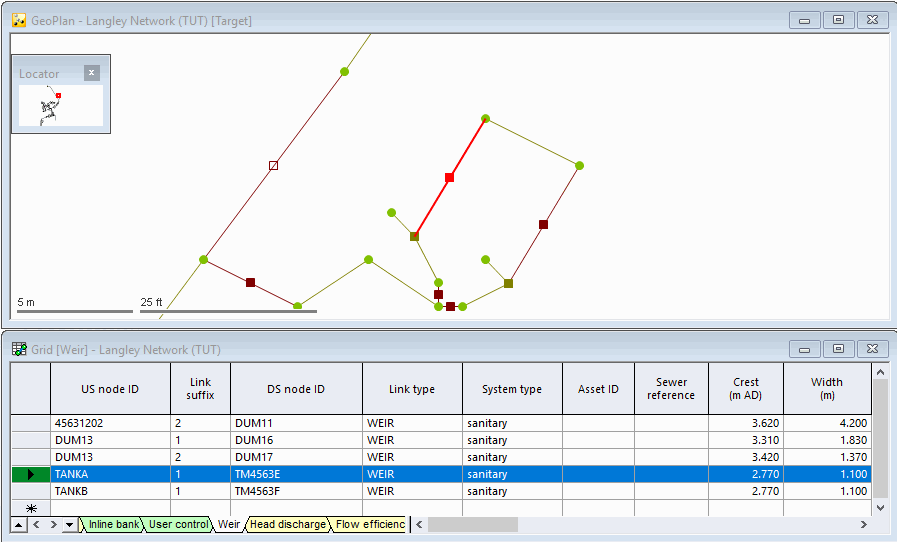
- Adjust the size and positions of the GeoPlan and grid windows so that you can see both clearly.
- Select a weir by clicking to the left of the record. The weir is highlighted on the GeoPlan.
- Select all links by clicking to the left of the first record and then Shift-clicking the last record.
- Right-click the GeoPlan and choose Zoom to selection from the pop-up menu.
- Click to close the grid.

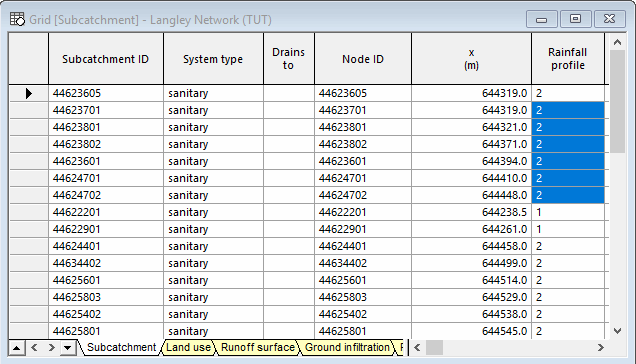
Applying different rainfall profiles to groups of subcatchments
You can use the Subcatchments grid view to apply different rainfall profiles to groups of subcatchments, for example, you can set up three profiles (which would be associated with three rain gauges) running from west to east across the network. To do so:
- Click on the Selection toolbar to clear
the current selection, if applicable.
- Right-click the GeoPlan and select Zoom to network to display the entire network.
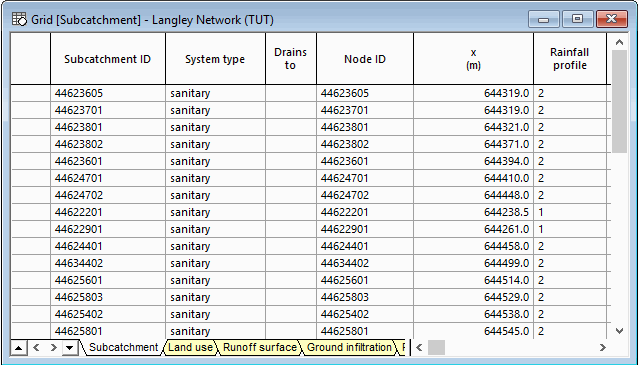
- Select Window | Grid windows | New subcatchment windows.
- Maximise the grid view.
- Find the Rainfall profile column.
- Move the Rainfall profile column so that it is next to the x (m) column and adjust the column widths.
- Sort the grid according to the values in the x (m) column.
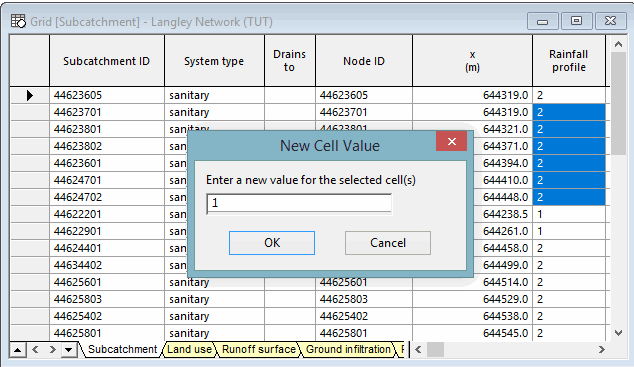
- Select all Rainfall profile cells for the first seven rows.
- Right-click the selection and choose Current Cell(s) Value | Set new value(s) for cell(s) from the pop-up menu, and a New Cell Value dialog is displayed.
-
Enter a value of 1 and click OK.
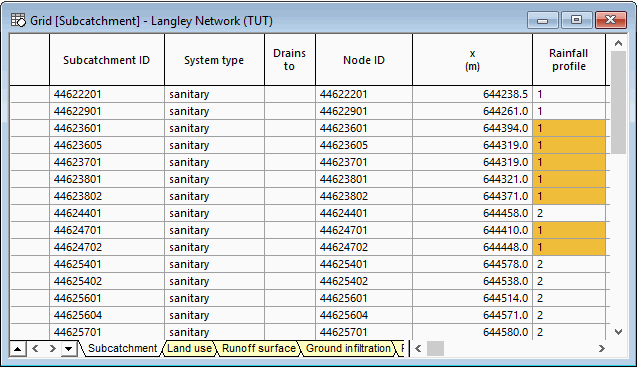
- Right-click again on the selection and choose Flags... then select the flag that indicates edited data.
- Re-sort the grid on Subcatchment ID.
The edited values now show up clearly.
- Click to close the grid.
Exporting grid data
It is possible to copy data to an Excel worksheet. For example:
- Open a Nodes grid and drag the x (m) and y (m) columns, as described previously, so that they are next to the Node ID column.
- Select the three columns so that the data is highlighted.
- Press CTRL + C to copy the data.
A message is displayed.
- Click Yes, to confirm copying of column headers.
- Open an Excel worksheet and press CTRL + V to paste the data.
- Close the Excel worksheet.
- Click to close the grid.
Property sheets
Property Sheets provide a way of looking at all the data for a single network object in a structured way. They are displayed in the Object Properties Window.
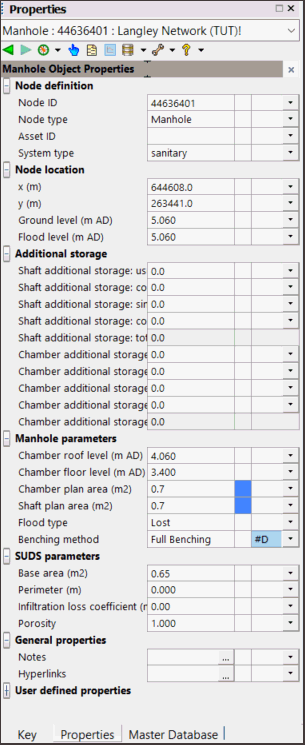
To display the Property Sheet for a network object, either use the Properties tool ( ) on the GeoPlan Window to select the appropriate object or click the Object properties window (
 ) button on the Docking Windows toolbar.
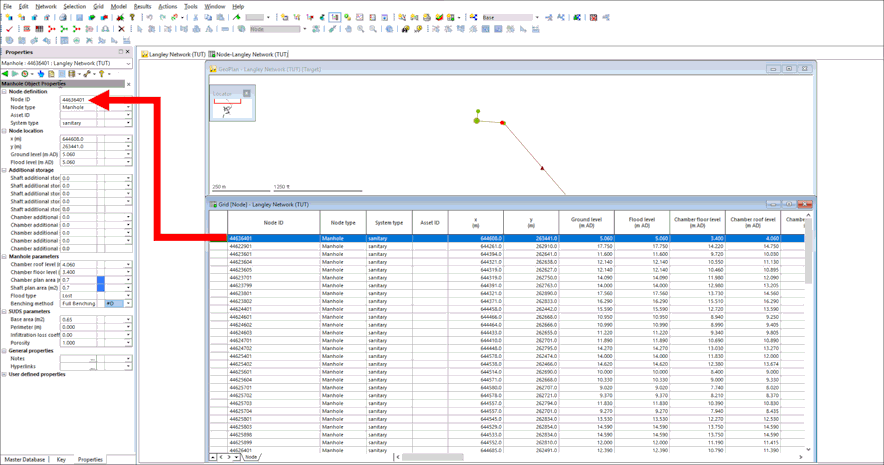
Alternatively, you can also display the property sheet for a particular object by doubling-clicking the left-most column entry for the required object in a property grid.
 Back to flowchart
