Well Control page
This page allows viewing and editing of well specific data fields.
There are two ways of determining head levels at a well node:
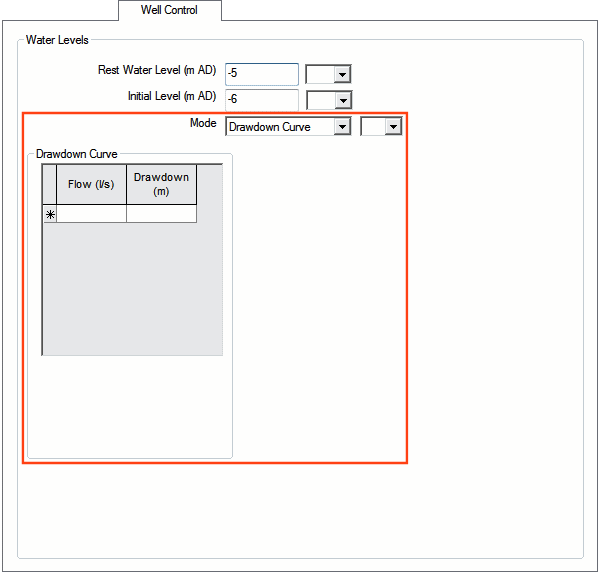
- Use the Drawdown Curve grid to enter a series of flow versus drawdown values.
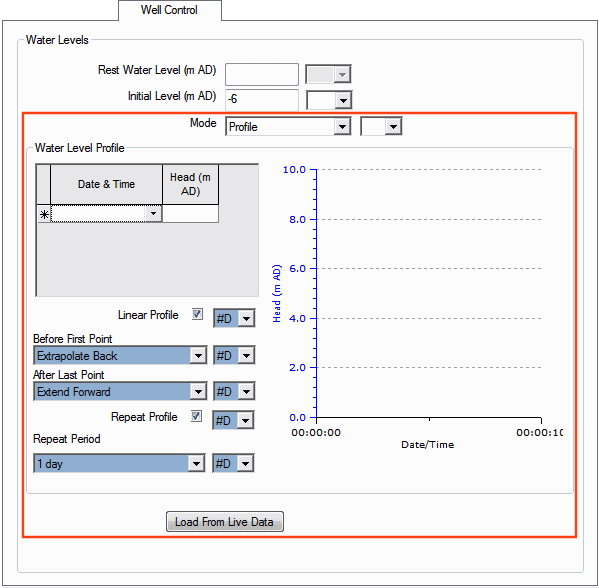
- Use the Water Level Profile grid to enter a series of head levels for the simulation. The Head level remains at the entered value from the Date and Time until the next date/time value or until the end of the simulation.
The page is displayed by clicking the Well Control tab on the property sheet for a well that has control data added.
Drawdown Curve grid
If Mode is set to Drawdown Curve, the Drawdown Curve grid is displayed.
You use the grid to enter a series of flow versus drawdown values.
![]() Show calculation for the head at the well
Show calculation for the head at the well
Linear interpolation will be carried out between flow / drawdown values entered in the grid.
If pumped flow is less than the first flow value entered in the grid, linear interpolation will be carried out between zero flow / zero drawdown and the first flow / drawdown value entered in the grid.
If pumped flow is greater than the last flow value entered in the grid, the last drawdown value entered in the grid will be used to calculate head at the well.
Note: Well head is calculated after each snapshot. This results in drawdown lagging one timestep behind pumping station flow.
Water Level Profile grid
If Mode is set to Profile, the Water Level Profile grid and accompanying controls are displayed.
There are two ways to set up the head level for a well in profile mode:
- Use the Initial Level field to set a head level that is constant throughout the simulation.
- Use the grid to enter a series of variable head levels for the simulation.
Note: If both an initial level and a series of variable head levels have been entered, the variable head levels are used.
By default, linear interpolation is used between data points. You can uncheck the Linear Profile box to use a stepped profile: each head value entered in the grid will be maintained until the next date / time entry, or until the end of the simulation.
Options for extending the profile outside of the entered dates / times
The Water Level Profile view of the Well Control page has options for extending the profile outside of the entered dates and times.
Option to use live data
You can load head data from a live data file and use this to control the level in the well.
You do this by clicking the Load From Live Data button and using the Link To Live Data dialog to choose your source and update the Water Level Profile grid. The Sensor Level dialog is then displayed for you to enter the sensor level (above datum).
The data in the file is treated as relative to the sensor level. The two are added to give values above datum. The default sensor level is the Elevation of the node.
Note: If the data in the live data file is not compatible with the control data, you will be warned, and no changes will be made.
When you have finished updating, close the dialog using the X button in the top right corner.
Option to clear the Water Level Profile grid
A quick method of clearing the grid is to use the Clear button on the Link To Live Data dialog.


