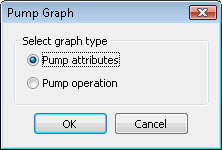
Pump Graph Dialog
The Pump Graph Dialog displayed when viewing simulation results for a rotodynamic pump using
the graph pick tool  on the Results Toolbar. The graph pick tool is used to display a graph of time varying
data for a single network object.

Select the Pump attributes option to display the Graph Pick Selection Dialog, which allows pump attributes other than pump operation to be graphed.
Select the Pump operation option to display a curve for the pump including display of all the operating points for the pump during the simulation.
