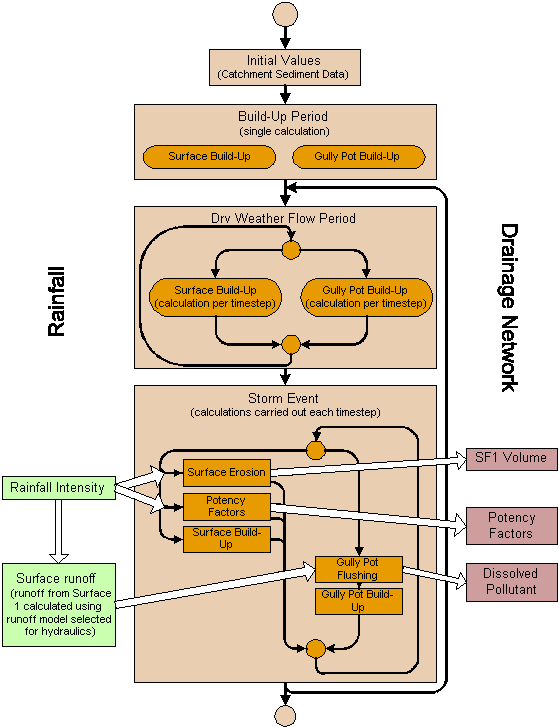
Surface Pollutant Model Process
The diagram below describes the operation of the Surface Pollutant Model as part of a simulation.
- You can set initial values for sediment mass on the catchment surface.
- You can model the build-up of sediment during the dry spell prior to a simulation.
- Once the simulation starts, you can have alternating dry weather periods and spells of rainfall:
- During dry weather, build up of sediment and pollutants continues.
- During a storm, sediment and pollutants enter the drainage network. Buildup also continues during storms.
Inputs to the model are down the left hand side of the diagram. Output to the drainage network is shown down the right hand side.
In the main boxes, the surface sediment process is on the left and the gully pot pollutant process on the right.

Schematic diagram of the Surface Pollutant Model during simulation
The model would normally be run without any initial mass of sediment on the subcatchment surfaces. Running the simulation with a long enough Build-Up Time (defined in the rainfall event) will allow sediment on the surface to build up to a steady state prior to the beginning of a rainfall event.
However, initial sediment masses can be set for subcatchment surfaces and used as well as, or instead of, a build-up period.
The initial conditions are set up on the Rainfall Event Editor.
The Initial Conditions topic gives an introduction to initialising a water quality simulation.
If a Build-Up Time is defined on the Globals Page of the Rainfall Event Editor, InfoWorks ICM will calculate the build up of surface sediment and gully pot pollutant over this period.
Build up before the start of the simulation proper is calculated in one calculation. Build up continues after the simulation starts, and is calculated at each timestep. However, the two methods of calculation should give identical results.
For details on how the build up is calculated, see Surface Pollutant Build-Up and Gully Pot Pollutant Build-Up.
If a rainfall event contains more than one sub-event, or the simulation starts before, or finishes after, the rainfall event, then there will be periods of dry weather flow.
When no rain is falling InfoWorks ICM continues to calculate build up of catchment sediment and gully pot pollutant at each timestep.
Even though build up before the start of the simulation proper is calculated in one calculation, and build up during the simulation is calculated per timestep, the two methods should give identical results.
For details on how the build up is calculated, see Surface Pollutant Build-Up and Gully Pot Pollutant Build-Up.
Rainfall on the catchment surface drives the process of sediment washoff and gully pot flushing.
Rainfall intensity is used to calculate the initial erosion of sediment from the catchment surface, and the potency factors of any pollutants attached to that sediment.
A value for surface runoff is then used to calculate the rate at which eroded sediment is washed into the network, and the rate at which dissolved pollutant is flushed from gully pots.
Unfortunately, for historical reasons, different runoff calculations are used for each of these processes:
- Sediment washoff from the surface uses the runoff values for Runoff Surface 1 and Runoff Surface 2 defined in the Land Use Definition. By convention these are both impervious surfaces - Runoff Surface 1 is the road surface and Runoff Surface 2 is the roof area. The runoff is calculated using the runoff model selected for hydraulic calculation.
- Gully Pot flushing uses runoff data calculated for Runoff Surface 1 (the road surface) using the runoff routing model you selected for the hydraulic calculations.
Surface erosion and Gully Pot flushing calculations effectively take place in parallel because the two parts of the model are completely independent.
For more information, see Surface Washoff and Gully Pot Flushing.
Surface erosion
The three parts of the surface sediment calculation take place in parallel. They all use the initial sediment mass at the start of the timestep.
Surface erosion and the potency of attached pollutants are calculated using the rainfall intensity.
All the sediment washed off the surface is treated as Sediment Fraction 1.
The rate at which eroded sediment runs off into the system is calculated using the runoff model chosen for the hydraulic calculations.
The calculations use the runoff from Runoff Surface 1 and Runoff Surface 2 defined in the Land Use Definition. By convention these are both impervious surfaces - Runoff Surface 1 is the road surface and Runoff Surface 2 is the roof area.
Surface build-up continues during storm events and the build-up is calculated in the same way as during dry weather periods.
Gully pot flushing
The amount of pollutant flushed out of gully pots is calculated using a value for surface runoff.
The calculations use the runoff from Runoff Surface 1 defined in the Land Use Definition. By convention, Runoff Surface 1 is the road surface.
The runoff is calculated by the hydraulic engine using the runoff model you selected for hydraulic calculations.
After the gully pot flushing calculation, the software calculates the amount of build-up in gully pots. The calculation is the same as that used during dry weather periods.
Build-up
During periods of rainfall, build-up of sediment and pollutants continues, even though the amount is probably insignificant compare to wash-off.
The calculation is carried out in the same way as during dry weather flow periods. See Surface Pollutant Build-Up and Gully Pot Pollutant Build-Up.
There are three inputs to the drainage network from the Surface Pollutant model:
- The volume of sediment washed off the surface. This sediment is always treated as Sediment Fraction 1.
- Potency factors for pollutants attached to the washed off sediment.
- Concentrations of dissolved pollutants flushed from gully pots.
 Water Quality

 . This indicates that
there is additional information available.
 button.