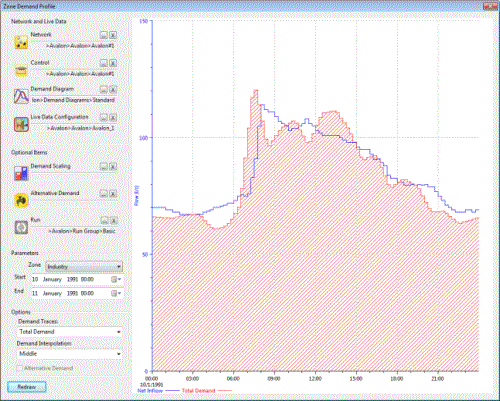
Zone Demand Profile dialog
This dialog allows the net inflow into a zone (calculated from live data points) to be compared with the demand assigned to network nodes in the zone.
The dialog is displayed by right clicking in theLive Data grid - Zone view and selecting Profile selected zone.
Notes:
- The net inflow into the zone is calculated from the live data points grouped in the zone. The list of live data points associated with a zone can be edited on the Live Data Zone property sheet - Zone page.
- The demand in the zone is calculated by summing the demand assigned to all nodes with Area Code matching the Zone ID.
|
Network and Live Data |
You can drag and drop items into the selection boxes or browse for an item using the Browse button. Required items:
|
|
Optional Items |
You can drag and drop items into the selection boxes or browse for an item using the Browse button. Optional items:
|
|
Parameters |
The zone to be graphed can be selected from the Parameters section. Start and end times for the graph may be adjusted. |
|
Options |
Options for graphing network demand:
|

