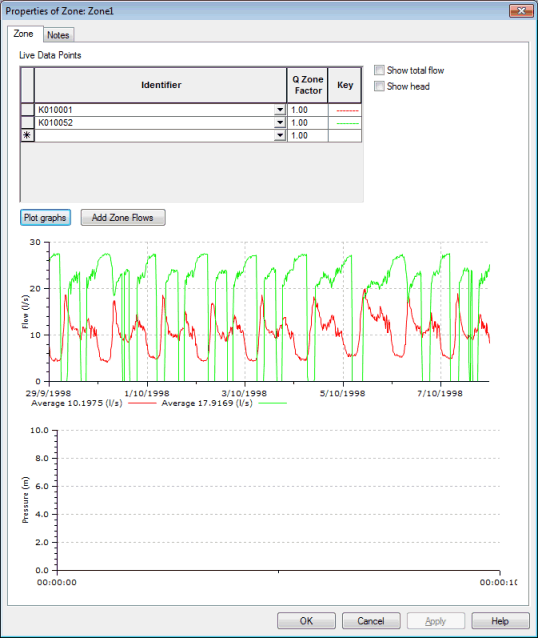
Live Data Zone property sheet - Zone page
This page allows the populating of zones with live data points. A zone will probably be a self-contained area of the water supply network, with one, or very few, inflows and outflows. Flow and pressure graphs can be generated for the zones on this page.
Note: Live data points must already exist before they can be added to a zone on this page.
The property sheet is opened from the Live Data grid - Zone view by right-clicking a zone name, selecting Properties, then selecting the Zone page.
| Item | Description | ||||||||
|---|---|---|---|---|---|---|---|---|---|
| Live Data Points (grid) |
|
||||||||
| Show total flow |
If unchecked, each flow is graphed separately. If checked, the sum of flow at all selected points is graphed. |
||||||||
| Show head |
If unchecked, displays pressure for each point. If checked, displays head for each point. |
||||||||
| Plot graphs (button) | Displays flow and pressure graphs for one or more points selected in the above Live Data Points grid. | ||||||||
| Add Zone Flows (button) |
Available only when there is a network open with associated control data. Used to search for live data points monitoring flows in or out of the current zone. Live data points found will be added to the Live Data Point grid, if not already present. This functionality requires the area codes at network nodes to correspond with the live data zone names. Inflow and outflow points are determined by searching for links associated with live data that are connected to one node with area code matching the zone ID and one node outside of the current zone. |
||||||||
| Graphs |
|
