Viewing Customer Points on the GeoPlan
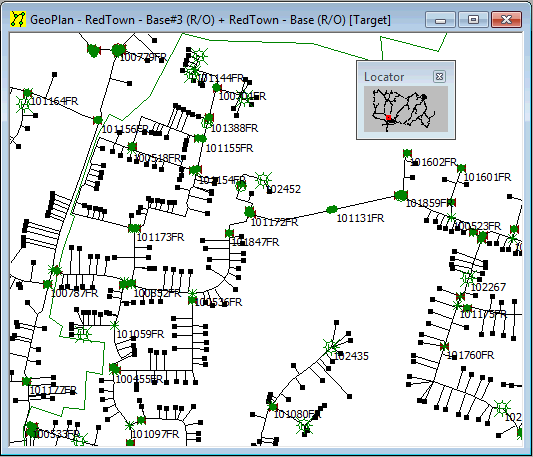
Customer Point objects and their assignment to nodes and pipes in the network can be displayed on the GeoPlan Window. The display of customer points is controlled using two of the pages on the GeoPlan Property Sheet.
Themes of customer points can also be displayed. See Displaying Themes for more information.
To adjust the display of customer points using the GeoPlan Property Sheet:
- Right click the GeoPlan Window and choose Properties from the context menu. This displays the GeoPlan Property Sheet.
- Choose the Display Tab. Here the parameters of the customer point symbol can be changed. By default, this symbol is a small square (the symbol is not larger because there are potentially many thousands of customer points in a network).
- check or un-check the Symbol box on the Customer Point row to show or hide the symbol. When the symbol is hidden a dot is displayed instead
- check or un-check the Show box on the Customer Point row to show or hide the customer point altogether.
- change the colour used to display the customer point using the Colour field. Click the existing colour to display a windows Colour Picker dialog
- Choose the Customer Points and Spatial Data tab. Here there are options to show assignment to pipes, or to nodes, or not to show assignment at all.
- If the Show assignment to pipes option is selected, a line is drawn from the customer point to its connection point with the network (defined by the Connection Point X and Connection Point Y data fields of the customer point).
- If the Show assignment to nodes option is selected, a line is drawn from the customer point to the node to which it is allocated.
- you show the assignment, a line is drawn from the customer point to the closest point on the pipe, or to the node, to which it has been allocated.
The picture below shows customer points connected to their allocated pipes/nodes on the GeoPlan Window.

