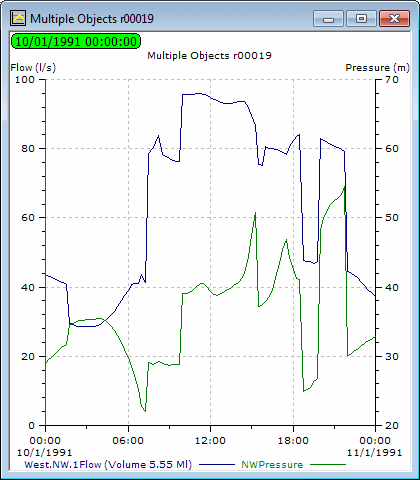
Graphing selected objects
Results can be graphed for a selection of network objects, allowing results from selected objects to be compared.
To view results and / or observed data for a selection of network objects:
- On an open simulation, select one or more network objects. (Any mixture of nodes, links and object groups may be selected.)
- If the objects selected are all of the same type, two shared parameters can be plotted.
- If a mixture of object types are selected, one parameter may be plotted for each type.
- If the selection includes nodes, links and object groups, only the nodes and links will be displayed for graphing.
- Click the
 (Graph selected objects) tool on the Operations toolbar.
 This displays the Graph Selection dialog.
- Select an attribute from the Left list and from the Right list. These are the parameters to plot on the two axes.
- If you want to reduce the number of traces displayed, deselect objects from the Links lists (either Left or Right).
- Select the options required from the dialog. You can:
- Use the Common Object Selection check box to synchronise the selections in the right hand list with those in the left hand list. This option is available only if the chosen network objects are all nodes or all links.
- Use the Swap Left/Right button to switch the two lists. The list on the left is displayed on the left axis of your graph.
- Use the Live Data button to select live data to be plotted on the graph.
- To display the graph, click OK.
Notes:
- Graph results can be displayed for a selected time period by adjusting
replay start and finish times on the Replay Options dialog and checking the Apply to Grid and
Graph Tools option.
Alternatively, to adjust the time period displayed by individual graphs, select Graph properties from the context menu, then use the x-axis scaling options from the Graph Properties dialog.
- On graphs produced by the
 (Graph) tool or the
  (Graph
selected objects) tool (see Graphing selected objects), the red time line
shows the current time of the simulation, mirroring the current time of
the simulation on the Geoplan. To
jump to a different simulation time, you can drag the red line
to the desired simulation time directly on the graph. The simulation date
& time will be updated accordingly on the Geoplan.
 - To display a label showing the value of the trace at the current time of the simulation, right-click the graph view and select Auto-label traces.

