Generating Diagnostic Polygons

Generating diagnostic polygons should be carried out for visual inspection of GIS and polygon areas. This procedure identifies the areas where errors have occurred in the recognition of shapes and how they overlay each other. The process of shape recognition and how shapes overlay each other is used in various tools. These include Area Take Off, Population from Census Area, Mesh Generation and Polygon Generation via intersection tool. The diagnostic polygons created must be deleted once the suspicious areas have been identified and the original data layer corrected.
Subcatchments, existing polygons and polygons from GIS sources may be used to generate diagnostic polygons.
Diagnostic polygons are created on top of the original polygons. Where the original polygons overlap, the diagnostic polygons created are divided so that each overlap area becomes a single separate polygon. (Note that the original polygons are not overwritten).
Once the errors in the original polygons are identified, the Geometry | Delete diagnostic polygons menu item under the Model menu should be used to remove all of the new polygons that have been created.
Suspect polygons and error polygons
If an error occurs in shape recognition and how shapes overlay, two distinct types of polygons (Suspect Polygons and Error Polygons) are generated and highlighted in red in the GeoPlan :
Suspect polygons – The total area of the diagnostic polygons generated from a single polygon is compared to that of the original. If this total surface is out by more than 10% (i.e. total area of the diagnostic polygons is smaller or larger by 10% to the surface of the polygon they originate from), it is flagged in the log with the details of the difference and the diagnostic polygon(s) have a category labelled as suspect.
Error Polygon - If an error occurred interpreting a point, an error polygon is drawn on the GeoPlan and is centered on that point. If multiple error polygons occur around a shape, this indicates the error has occurred somewhere along this shape but the exact location can not be identified.
Polygon theme
If the Apply Theme checkbox has been left ticked on the Create Diagnostic Polygons Dialog, diagnostic polygons are assigned by default a theme based on their category.
The user is informed that a new theme has been generated for diagnostic polygons. The new theme is available for the Polygon object layer and can be edited like any other theme via the Layers and Themes page of the GeoPlan Properties dialog.
It is recommended to click Yes on the message that gets displayed following diagnostic polygon generation in order to save this theme as a database object. This theme gets deleted from the Polygon themes whenever diagnostic polygons are deleted so it is a good idea to have a copy of it saved in the Database tree.
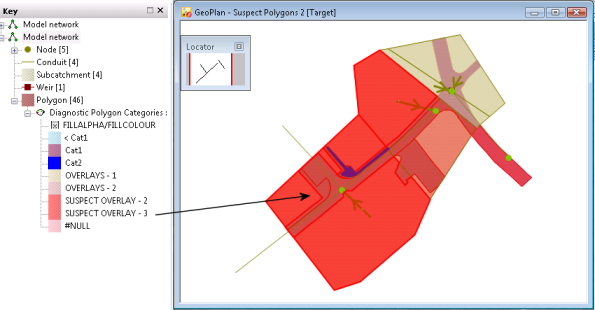
Suspect polygons are highlighted in bright red. Other overlay polygons get assigned other colours, as shown below. The original polygons are assigned the same colours by default. (In the screenshot below, cat1 and cat2, which are the categories of the original polygons, have got both the same colour).
Please refer to the Layer Theme Editor topic for further details on the different panes of the view.
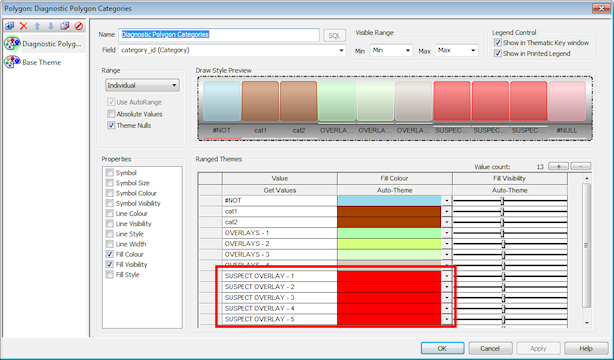
The Diagnostic Polygon Categories theme is automatically removed from the polygon themes when diagnostic polygons are deleted.
ID, Category and user-text fields for the newly created polygons
Newly created polygons are given IDs that are the combination of the original objects they derive from (prefix), and of a suffix of the type '_PX' where P stands for polygon and X is an integer.
In the screenshot below, for example, P03_P3 polygon is the only polygon derived from original polygon P03. On the other hand, Subcatchment SubA, when intersected, resulted in the generation of 3 different polygons: SubA_P0, SubA_P11 and SubcA_P4.
Newly created polygons are also given a category indicating the level of overlay. The category assigned to a polygon depends on the order objects have been selected in the Create Diagnostic Polygons dialog. User text field 1, 2, 3, 4 and 5 are used to mark the newly created polygons with the ID of objects they originate from.
If the objects to be intersected are all of the same type (e.g. subcatchments only or polygons only), the IDs of the objects a polygon originates from will be appended in the same user text field. On the other hand, if objects of different type are being intersected (e.g. subcatchments and polygons), then different user text fields will be used.
Examples
The method of carrying out the generation of Diagnostic Polygons and the results produced are best demonstrated as examples:
Example 1 - network subcatchment and a polygon representing a road overlap one another
| ID | Cateogry | |
|---|---|---|
|
Subcatchment |
SubcB |
|
|
Polygon |
Poly A |
Poly Cat1 |
- Select Geometry | Create diagnostic polygons from the Model menu. This displays the Create Diagnostic Polygons Dialog.
- From the Create Diagnostic Polygons Dialog:
- To include the network subcatchment for polygon generation:
- Select the Subcatchment option from the Network Object dropdown list for the first overlay.
- Do not tick the Selection checkbox (this can be used if some objects are selected on the GeoPlan, prior to the display of this dialog)
- To include the network polygon for polygon generation:
- Select the Polygon option from the Network Object dropdown list for the second overlay
- Do not tick the Selection checkbox
- Leave the Apply Themes checkbox ticked
- Click on the OK button
- Click on Yes on the message that gets displayed (Click on No if you do not wish to save the theme as a database object, and go to step 5).
- The Common Tree Selection dialog gets displayed.
- Type in a name for the theme and browse for the desired location.
- Click on Save.
- Click on OK on the Select Properties to Save dialog.
- The theme is saved as a database tree object.
- A log file is produced. You can minimise the HTML form once you have checked that no errors were produced.
- Investigate the new polygons:
- A polygon theme based on the polygon category has been applied to these polygons
- Investigate the new polygons using the GeoPlan and the Polygon Grid Window. Five new polygons have been created:
- Newly created polygons (Subcatchment_P0, Poly_P1, Poly_P3, Subcatchment_P4) that do not result from any overlap of the original objects are given a category of OVERLAYS-1 .
- Poly_P2 which results from the overlap of the "Subcatchment" subcatchment with the original polygon (Poly) has been assigned a category of OVERLAYS-2.
- Subcatchment_P0 and Subcatchment_P4 which are cut-outs resulting from the subcatchment only have the subcatchment ID on their user text 1 field. User text 1 has been used for the subcatchment as we selected the subcatchment first in the Create Diagnostic Polygons dialog (see step 2 above).
- Poly_P1 and Poly_P3 which arise from the original polygon only have the polygon ID on their user text 2 field. User text 2 has been used for these polygons as we selected the original polygon in second position (after the subcatchment) in the Create Diagnostic Polygons dialog.
- Poly_P2, which consists of the overlap area of the subcatchment and the original polygon has been assigned the subcatchment ID of the subcatchment it originated from in user-text 1 and the original polygon ID in user-text 2.
Example 2 - Two network polygons overlapping one another
This case is very similar to the previous example, except that we are now interested in objects of the same type (a polygon overlapping another polygon).
| ID | Category | |
|---|---|---|
|
Polygon A |
Poly A |
Poly Cat1 |
|
Polygon B |
Poly B |
Poly Cat2 |
As can be seen from the screenshot below, the polygon resulting from the overlap between the two original polygons has been assigned the two IDs of the polygons it originates from and these are appended in the user-text fields (Poly A + Poly B).
Example 3 - suspect polygons
This section shows the example of an intersection that has resulted in the generation of a suspect polygon. As the Apply Theme checkbox of the Create Diagnostic Polygons dialog has been left ticked, a polygon theme is applied by default to the newly created polygons.
Suspect polygons are highlighted in red.
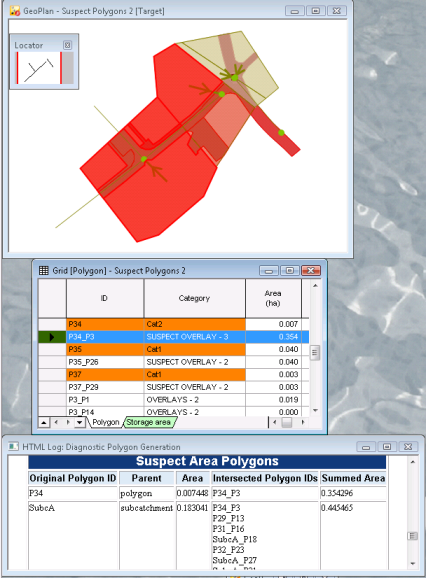
A closer investigation of the Polygons grid and the log file allows us to understand why some polygons have been marked as suspect.
Newly created polygon P34_P3 (suspect polygon in red in the screenshot above) is the only polygon originating from polygon P34 (coloured in blue / purple for the purpose of this example). Area of P34_P3 is 0.354 ha whereas area of P34 is 0.007. The surface difference being out by more than 10% of the original surface, the newly created polygon is considered as suspicious. This indicates that the user should simplify the geometry of polygon P34.
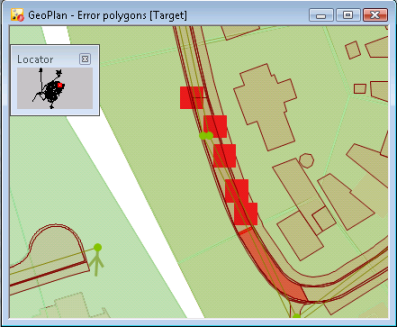
Example 4 - error polygons
This example shows a network on which a series of error polygons have been generated. This points the user to the areas to investigate.
If you cannot easily see the error polygons on a too dense a network , you can use a combination of the log file (you can identify the original polygon IDs there) and the GeoPlan search tools to locate them on the network. Alternatively, you can modify the Diagnostic Polygon theme or any other GeoPlan theme to make the error polygons more visible or prominent in the GeoPlan. Please refer to the Managing Themes topic for further details.
Log
A log is produced including details of time taken for polygon creation and the number of vertices and edges created.
The Log will also show error messages and warning messages. It will, for example:
- give a count of error polygons
- list all zero area polygons (these are ignored during intersection but are logged for information)
- provide information on suspect polygons (polygons they originate from and surface difference between the original polygons and the new polygons).
The log is saved temporarily in the Local Working Folder as an html file. When the log is closed in InfoWorks ICM, the log file in the Local Working Folder will be removed. To view the log at a later date, save it using the Save button of the File toolbar.
Suggestions for cleaning your data
When errors occur in shape recognition, you have at your disposal several tools in InfoWorks that enable you to clean the data allowing improvements in performance time and reducing the size of data generated. See Simplifying Object Geometry for more details. These tools are mainly thinning tools and cutting tools.
If an error has occurred at a single point then at the intersection of various polygons, edit the data to move these points apart.
If multiple error polygons occur around a shape, this indicates that the error has occurred somewhere along this shape but the exact location cannot be identified. By moving each point around this shape you will eventually identify what is causing the error. However the simplest and quickest option is to re-draw the shape. If it is a large shape, cut this shape into smaller sections. Then just re-draw the smaller section that still has a problem.
If a suspect polygon is generated and within this polygon, there is an area with no polygons, you should cut the surrounding shape.
GIS tools can be used to edit and clean the shapes.
Where a RowID column is used it is important to repopulate this column after performing the clean tools to avoid duplicate IDs.
For shape files, ESRI provides ArcScripts free to download at http://arcscripts.esri.com/. The Compiled Table Tools has an option to add a unique ID and Compiled Theme Tools to explode shapes. Individual objects can be explored in the shape properties.
For tab files, the MapInfo tools available are : Disaggregate, Splitting A Map Object, and Clean. To add the unique ID in MapInfo, update a column with the value rowid.
Please refer to your GIS package Help for more details.
