Two Dimensional Flood Routing Basics
|
Innovyze Howbery Park Wallingford Oxfordshire OX10 8BA United Kingdom +44 (01491 821400 |
|
||
|
Technical Paper December 2007 |
|||
Glossary
2D zone- Area within which the mesh is created.
Mesh zone - Optional area within which the size of the mesh triangles can be changed from the default. Mesh zones exist within 2D zones.
Roughness zone - Optional area within which the surface roughness can be changed from the default. Roughness zones exist within 2D zones.
Mesh - Series of joined triangles which form the 2D surface, created within the 2D zone.
Shewchuk triangle - Method of triangulation used to form the mesh, Reference 1.
General line - Generic line which can then be specified as a wall or break line.
Void - Optional polygons into which no flow can enter.
Wall - Optional lines through which no flow can pass.
Break line - Optional lines used in the creation of the mesh.
1. Introduction
This technical note describes the two dimensional flood routing module which is available in InfoWorks ICM.
To be able to use this functionality, you need to have the 2D option enabled on your licence. Please contact Innovyze for information.
The module uses the existing one dimensional simulation engine to calculate all flows below ground level. Once manholes start to flood, the floodwater flows across a two dimensional zone representing the surface of the catchment.
Chapter 2 describes the 2D zone and its creation. The inclusion of features such as buildings, walls, areas of different surface roughness and many other features which may exist in an urban catchment are described. The interaction between the 2D zone and the below ground system is also presented.
Chapter 3 presents simulation parameters relevant to 2D simulation and provides advice on how to check for modelling instabilities. Practical modelling advice is also provided because 2D simulations are computationally intense and produce large volumes of data. It is therefore important to target 2D simulation only in areas which experience significant and complex flood processes. 1D flood routing can be used in parts of the model where the detailed 2D analysis is not required.
Chapter 4 illustrates the presentation of results from the 2D simulations.
2. The 2D zone
The 2D zone, alternatively described as a mesh, consists of a series of contiguous triangles, whose shared boundaries cover the catchment surface. The height of each point on each triangle is derived from a ground model GRID or TIN. An example of a 2D zone is presented in Figure 1.
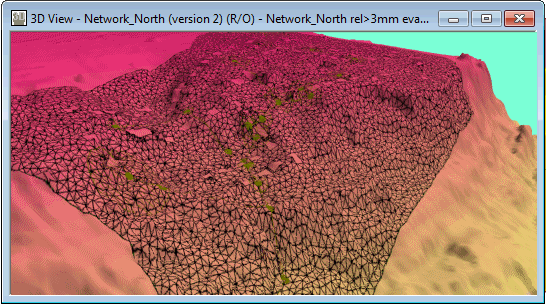
Figure 1 - Example 2D Zone
It is significant that the 2D zones are meshed, where the size and orientation of the triangles can be varied, rather than a grid, where the layout is fixed. Meshes allow more detail and complexity in locations only where it is needed.
Triangles are derived using the Shewchuk triangulation method (Reference 1).
Each 2D zone must include a boundary and the characteristics of the triangles within the zone must be defined. The creation of a 2D zone is described in section 2.1. A 2D zone can include the following elements:
- Voids, polygons into and through which no flow is allowed, can be used to represent buildings. The creation of voids is described in section 2.2.
- Walls, lines through which no flow can pass are described in section 2.3.
- Break lines, lines along which the triangle boundaries must be created. These can be used to define the top of a ridge or the low point in a channel. They are described in section 2.4.
- Mesh zones, polygons within the 2D zones where the triangles have different maximum triangle area. They are most commonly used to define smaller triangles in areas of greater complexity and are described in section 2.5.
- Roughness zones, polygons where a Manning’s roughness which differs from the default can be specified. These are described in section 2.6.
2D zone triangles can be created once all the objects and the ground model have been prepared. This process is described in section 2.7.
The interaction with the below ground system whereby water floods from the manholes on to the 2D zone and then possibly back into the manholes is described in section 2.8.
2.1 The 2D Zone
A 2D zone can be either created within InfoWorks ICM, or imported from a GIS layer using the ODIC, which is described in section 2.1.1.
To create a 2D zone within InfoWorks ICM, create a polygon by using the New Object button ( ) and setting the object type to Polygon in the adjacent Object Type dropdown list. Choose the 2D Zone type in the New Polygon dialog. This process is shown in Figure 2. A unique ID must be specified for each 2D zone.
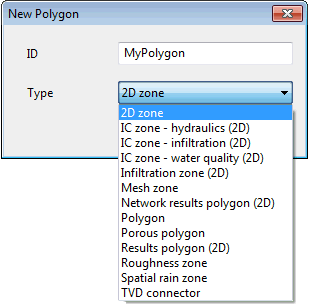
Figure 2 - Creation of a Polygon Type '2D Zone'
Once the 2D zone has been created, the Object Properties Window gets displayed with the properties of the 2D zone (see Figure 3):
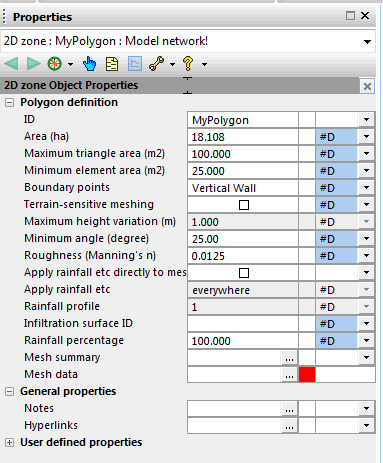
Figure 3 - 2D Zone Object Properties Window
- The area is automatically calculated and should not be altered.
- The maximum and minimum triangle / mesh element areas (Maximum triangle area and Minimum element area fields) define the limits of the Shewchuk triangles. It is suggested that an initial run is completed using the default maximum and minimum sizes. The results should then be assessed and smaller triangles (more detail) created in areas where the flood processes are more complex. These smaller triangles are created using mesh zones. The Minimum element area fields must be set to a value smaller than the Maximum triangle area field. It is recommended that the value of the Minimum element area field be set to a value not greater than 50% of the Maximum triangle area field. The 2D fluid dynamics engine groups mesh elements into conglomerations not smaller than the Minimum element area. Decreasing the minimum element area will tend to increase the run time for 2D simulations.
- The boundary type (Boundary points property) defines what happens to the flow when it reaches the edge of the 2D zone. Five options are available:
·
- Vertical wall
- Critical condition
- Supercritical condition
- Dry
- Normal condition
Further information is included in the 2D Zone Data Fields topic. If is it not clear what happens to the flow when it reaches the boundary, then the critical condition is recommended.
- The minimum angle (Minimum angle field) controls the shape of the mesh elements generated by Shewchuk Triangle. Setting the angle to a small value will allow Shewchuk Triangle to generate more long thin triangles. This can be beneficial in circumstances in which the geometry of the voids is complicated and irregular and a large number of small triangles are generated when using the default value. Increasing the minimum angle will produce more equilateral triangles. The algorithm used by Shewchuk Triangle is mathematically guaranteed to converge up to a maximum angle of 33.8 degrees and can (although generally will not) converge for larger angles. However, using a large value of the minimum angle will lead to a very large number of small triangles and the process may fail due to lack of memory. In some situations, such as in the narrow gap between buildings it may be necessary to either reduce this value or the minimum mesh element area. ·
- The Manning’s (n) roughness (Roughness (Manning's n) field) defines the surface resistance to flow. The higher the value, the greater the resistance.
The 2D Zones can also be displayed as a grid by selecting the New polygons window button  .
.
This grid is shown in Figure 4.

Figure 4 - Polygons Window
2.1.1 Import of a 2D Zone
Import of a 2D zone can only be completed using the ODIC. An example of the ODIC dialog, during the import of a 2D zone is presented in Figure 5. The drop down menu used to specify the 2D zone is highlighted in Figure 5. Once the 2D zone is specified, the object fields are automatically customised to those relevant to a 2D zone. Of these, it is only necessary to defined the ID at the time of import. Other fields can be specified later, either directly within InfoWorks ICM or using the ODIC.
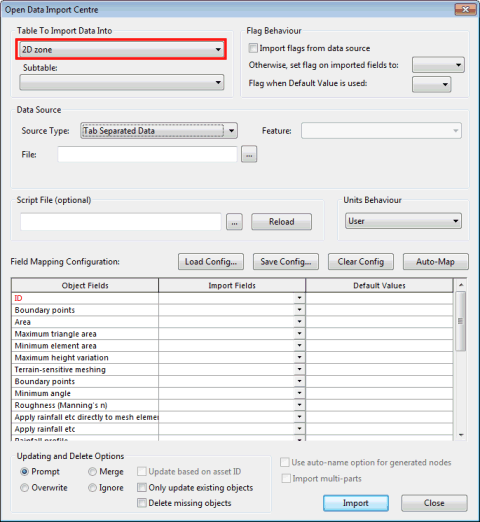
Figure 5 - Import of a 2D Zone using the ODIC
2.2 Voids
Voids define an area into which flow cannot enter. They can be used to represent features such as buildings.
Voids are used in the generation of the 2D zone triangles, described in Chapter 2.7. During this process voids from either a GIS file, a layer or an InfoWorks ICM polygon can be used.
The advantage of using InfoWorks ICM polygons is that all the data is then contained within the InfoWorks ICM database and that the ICM geometry tools can be used to clean the data. These polygons can be imported using the ODIC. Once the voids are imported, they can be simplified or cleaned up using the simplify geometry tool described in section 2.2.2.
To create a void within InfoWorks ICM, create a polygon by using the New Object button ( ) and choosing a type of Polygon. In the New Polygon dialog, select Polygon in the Type dropdown list. This process is shown in Figure 6. A unique ID must be specified for each void polygon.
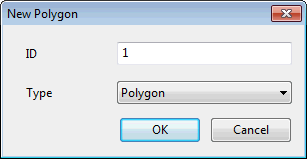
Figure 6 - Specification of a Void Polygon
All voids must have the same category. Any name can be used for this category, but it is sensible to call it void. Figure 7 shows the Object Properties window of a polygon for which the Category field has been set to Void, as well as the Polygons Window with several voids. Each polygon which represents a void has been given the relevant category type (again preferably called void).
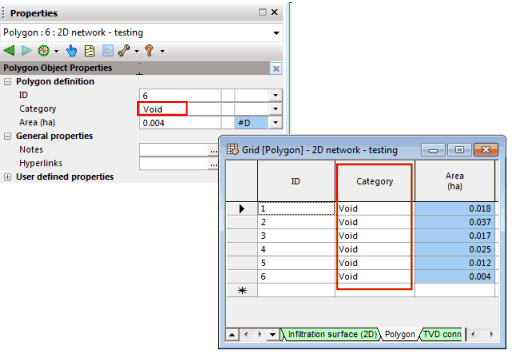
Figure 7 - Voids shown in Polygon Window
Figure 8 illustrates the effect void areas have when generating Shewchuk triangles. Triangles are not created for the areas inside the voids.
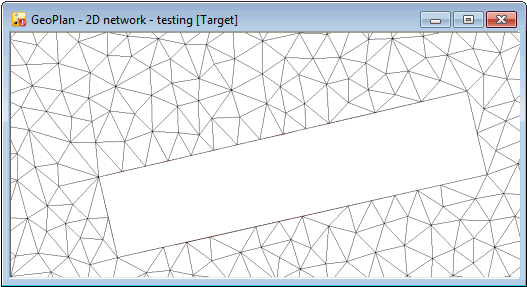
Figure 8 - Effect of Voids on Generation of Shewchuk Triangles
2.2.1 Import of Voids via the ODIC
The same methodology employed to import 2D zones is applied to voids, with the exception that the Table To Import Data Into, highlighted in Figure 5 should be specified as a Polygon, rather than a 2D zone.
2.2.2 Simplify Geometry of Voids
Once the voids have been created or imported, they can be ‘cleaned up’ using the simplification tool. This process removes unnecessary or erroneous polygon vertices and reduces complex polygon geometry. This process is accessed under Model | Geometry | Simplify... The on-line help includes a full description of this process.
2.3 Walls
Walls are lines through which no flow can pass. These have largely been superseded by Porous Walls and Base Linear Structures but remain for backward compatibility.
An example of the effect of a wall is presented in Figure 9.
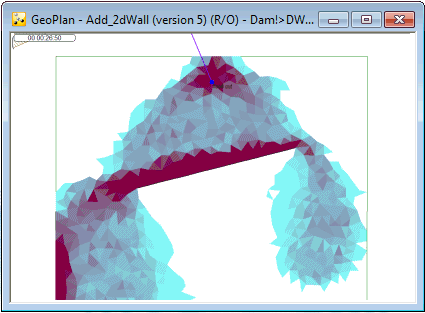
Figure 9 - Flow around a Wall
Like voids, walls are used during the creation of the 2D zones triangles described in section 2.7 and during this process can be obtained from a GIS file, a layer or a general line in InfoWorks ICM. These lines can be either specified directly in InfoWorks ICM, using the New Object button ( ) and setting the Object Type dropdown to Line, or imported using the open data import centre which is described in section 2.3.1.
Walls and break lines, described in section 2.4, are both classed as ‘general lines’. The only thing which differentiates them is the line category. All walls must have the same category. It is recommended that the category ID is simply called Wall.
Once a line is generated, the dialog box shown in Figure 10 will appear. Select General line in the Type dropdown list. Here is it possible to select a category, using the drop down menu, or to create a new category:
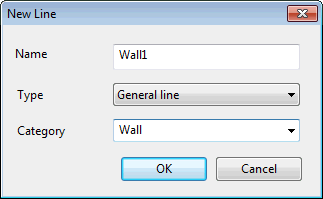
Figure 10 - NewLine Dialog
Lines can also be displayed in grid view, using the  button.
Lines can be edited, joined or split using the Edit Geometry button ( ).
).
2.3.1 Import of Walls Using the ODIC
Walls are imported using the ODIC in the same way as the 2D Zones shown in Figure 5. The only difference is that General line should be specified as the Table To Import Data Into. Again only the name of the line must be specified at the time of import.
2.4 Break Lines
Break lines define lines along which the Shewchuk Triangle boundaries will be created. An example is presented in Figure 11.
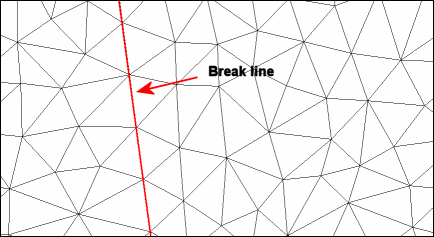
Figure 11 - Triangle Boundaries Defined by Break Line
Break lines are useful in defining a high or low location such as a ridge or the base of a ditch.
Break lines are imported during the 2D zone creation process, specified or edited within InfoWorks ICM and imported using the ODIC in exactly the same way as walls. The only difference is the category. Again all break lines must have the same category and it is recommended that they are simply called Break line.
2.5 Mesh Zones
Mesh zones are polygons within which a alternative maximum triangle size can be specified. Mesh zones are usually used to specify a smaller triangle size to represent specific areas in greater detail. These are useful in areas where greater detail is required.
Mesh zones are generated in the same way as 2D Zones, described in section 2.1. The only difference is the type, shown in Figure 6, is defined as Mesh zone.
Once a mesh zone is created, its Object Properties Window will be displayed. An example is shown in Figure 12.
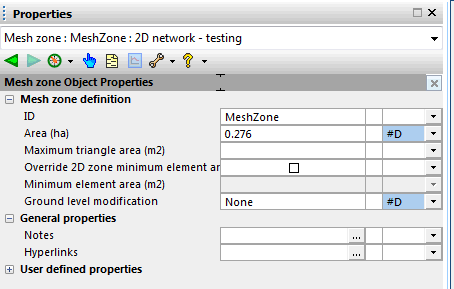
Figure 12 - Mesh Zone Object Properties Window
Many mesh zones, with different maximum triangle sizes can be defined within one 2D zone.
Mesh Zones can be displayed as a grid by selecting the New polygons window button  , and selecting the Mesh zone tab.
This grid is presented in Figure 4.
Mesh zones can be imported using the Open Data Import Centre, by specifying Mesh zone as the Table To Import Data Into. An example of this is presented in Figure 4.
2.6 Roughness Zones
Roughness zones are generated or imported in the same way as mesh zones. The characteristics of a roughness zone is specified in the same way as a 2D zone.
Roughness zones allow an area with a different Manning’s n value to be specified, as shown in Figure 13. This is necessary to represent the differing flow characteristics across a road or grassed area for example.
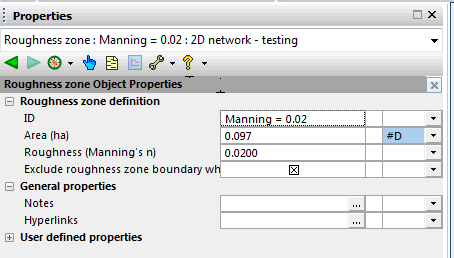
Figure 13 - Different Roughness Value
2.7 Generation of the 2D Zone Triangles
Creating 2D zone triangles (the mesh) is a two stage process. First the Shewchuk triangles are created, then a level is applied to the vertices of each triangle. The ground model is used to determine the levels but plays no part in the creation of the triangles, unless the Terrain-sensitive meshing option is used. The ground model elements do not have to be coincident with the vertices of the triangles.
The triangles are generated by first selecting the 2D Zone. Any mesh and roughness zones wholly or partly within the 2D zone are automatically selected. Meshing and Mesh 2D zones... are then subsequently selected from the Model menu. This launches the Mesh 2D Zones dialog shown in Figure 14.
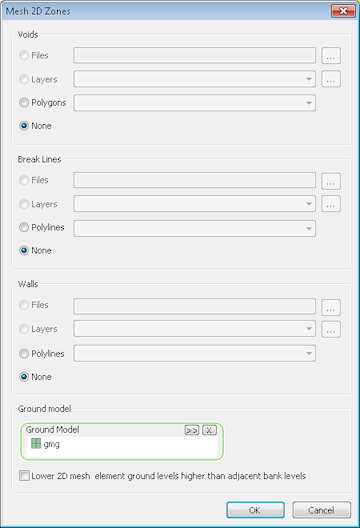
Figure 14 - Mesh 2D Zones Dialog
The voids described in section 2.1, the walls described in section 2.5 and the break lines described in section 2.7 can then be specified from one of the three sources, GIS file, Geoplan layer or InfoWorks ICM polygons.
The X and Y coordinates, levels, the area and the roughness of any mesh element can be obtained by clicking on it with the  button.
2.8 Interaction with the Below Ground System
Only manholes with a flood type of 2D, Gully 2D and Inlet 2D are capable of conveying flood water onto the 2D mesh. No other flood types interact with the 2D mesh.
A manhole with a flood type of 2D acts as a weir allowing flood water to pass from the manhole on to the mesh or vice versa. The length of this weir is defined by the circumference of the manhole shaft. The discharge coefficient of this weir is defined by the Flooding discharge coefficient, which can be specified by the user as part of the manhole parameters shown in Figure 15.
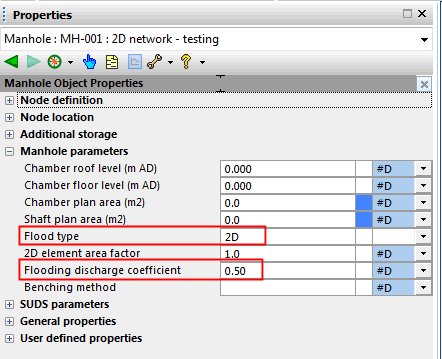
Figure 15 - 2D Flood Type
It is important that the manhole ground levels match the height of the ground model at the relevant location. Otherwise flow could spill on to the mesh either earlier or later than it reaching the manhole ground level. One way to achieve a good match between manhole and ground model ground levels is to infer the manhole ground level from the ground model using the inference tool.
3. Running Simulations
A simulation involving 2D flooding is scheduled in the same way as a 1D simulation. The only difference is that 2D parameters can be configured via the 2D parameters button which is highlighted in Figure 16.
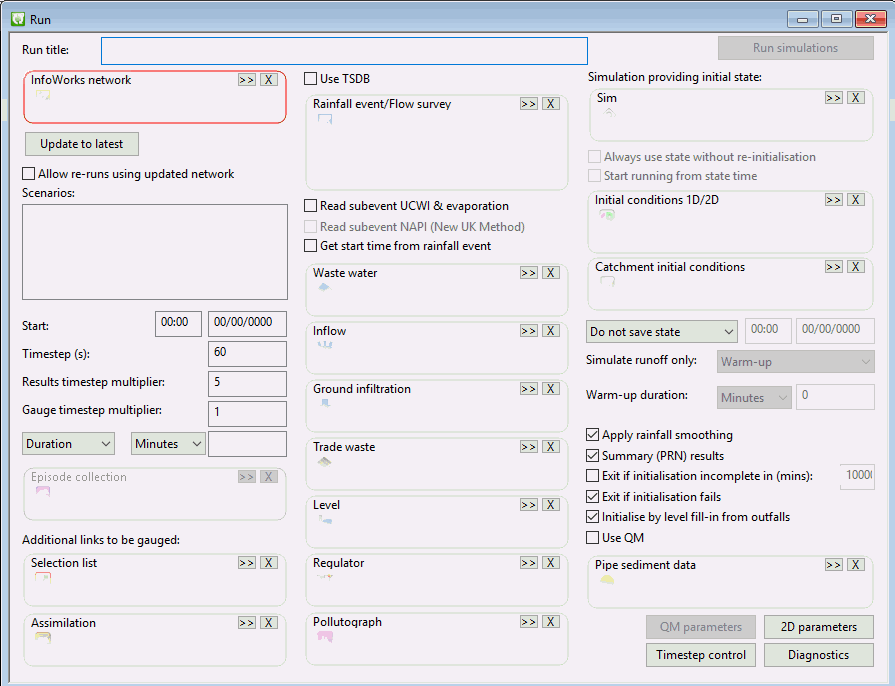
Figure 16 - 2D Parameters in Schedule Hydraulic Run Dialog
The 2D parameters dialog comprises four tabs The parameters associated with the General and the Advanced tabs are explained in Figures 17 and 18.
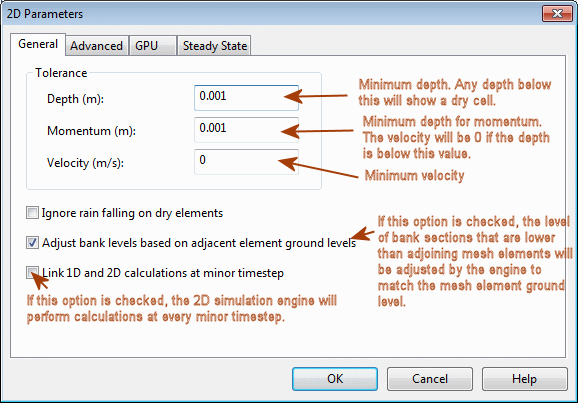
Figure 17 - 2D General Parameters
Please refer to the 2D parameters Dialog topic for information on the GPU and Steady State pages.
The InfoWorks ICM 2D engine will consider any mesh element in which the depth of water is lower than the depth parameter, to be dry.
The InfoWorks ICM engine will consider the momentum of the water in any mesh element in which the depth of water is lower than this value to be zero.
The InfoWorks ICM engine will consider the velocity of the water in any mesh element in which the velocity of water is lower than this value to be zero.
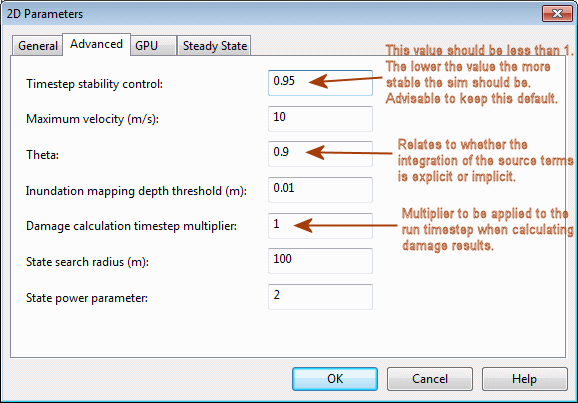
Figure 18 - 2D Advanced Parameters
Users are currently recommended to choose the default values shown in Figures 17 and 18 for all simulations.
The calculations used by the 2D simulation are presented in Reference 2. Being partially explicit they are therefore influenced by the simulation time step. The recommended timestep will vary according to the size of the mesh. For relatively large meshes, a timestep of 20 – 30 seconds would be appropriate, but for smaller meshes, 5 seconds or even less should be used. The results should be checked for mass balance errors and if necessary the timestep reduced.
The Relax tolerance from run - simulation and Relax tolerance from run - initialisation parameters are implemented by default and should be kept switched on when running 2D simulations. These simulation parameters can be accessed via the Model | Model parameters | Simulations parameters menu option and are shown in Figure 19.
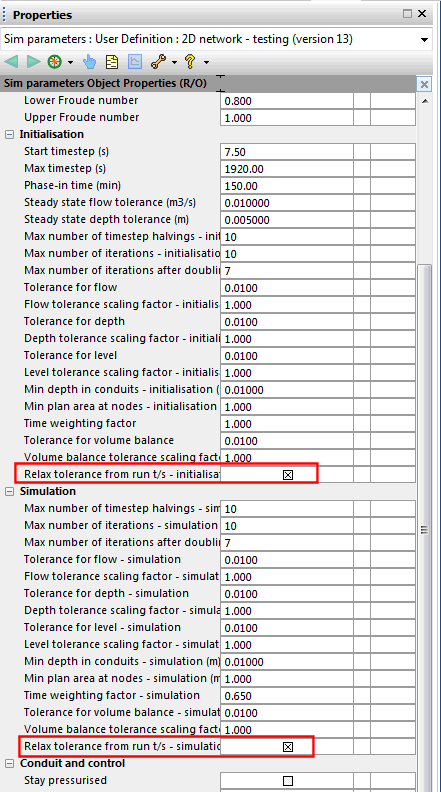
Figure 19 - Simulation Parameters
The simulation should be checked for stability by assessing the results .log file, accessed by right clicking on the results icon and selecting ‘open as’. An annotated version of the .log file is presented in Appendix A. The main item to assess is the mass error report near the end of the file.
4. Results
The following methods of displaying the results relate specifically to 2D flooding.
4.1 Themes
4.1.1 2D Zone Themes
A 2D elements section is included in the Elements page of the Geoplan Properties and Themes dialog to allow the Shewchuk triangles to be themed.
Depth is only calculated at the centroid of each Shewchuk triangle. This depth is then assumed to exist across the whole of each triangle. In reality depths would vary across each triangle.
In InfoWorks ICM, Shewchuk triangles may be coloured based on the values of depth, speed or direction.
To enable arrows indicating flow speed to be viewed on the GeoPlan, open the GeoPlan Properties Dialog and click on the Edit button of the Theme column for the 2D zone. Enable the Flow Arrows theme by clicking on the  button. It is suggested that a number of ranges are defined (say 10). The zero value should then be changed from zero to a small value, or the visibility of very low values set to zero so that arrows will not be displayed at very low speeds.
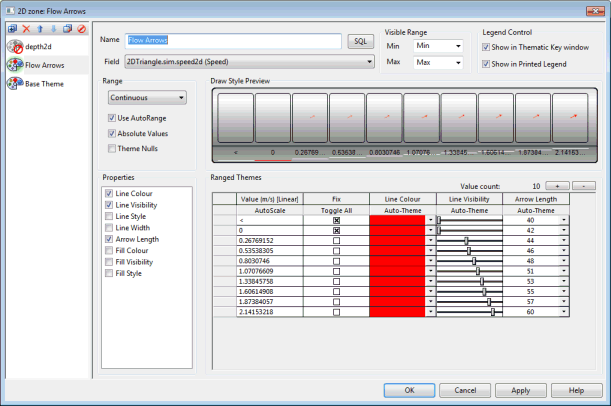
Figure 20 - 2D Arrows Theme
To include a theme based on the 2D depth of Shewchuk triangles, enable the depth2d theme. It is suggested that a number of ranges are defined (say 10 or 20). The zero value should then be changed from zero to a small value. A value of 0.001 is suggested for depth (click on Toggle All to edit the value). This is shown in Figure 21. If a flashing effect is observed where mesh elements turn from white to the 0.001 colour and back again frequently and rapidly, then this number should be increased above 0.001. Finally set the fill visibility to appropriate values by using the sliders.
Figure 21 shows the various components of the 2d depth theme.
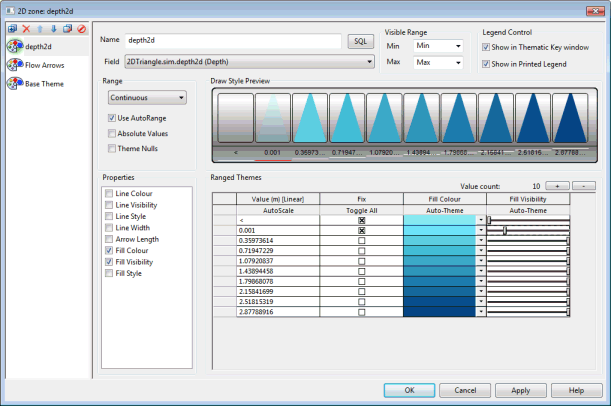
Figure 21 - 2d Depth Theme
The effect of a 2D triangle theme based on depth and a variable 2D arrow theme based on velocity is illustrated in Figure 22.
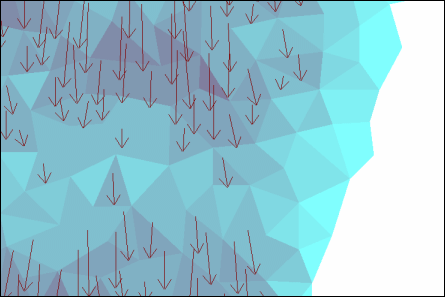
Figure 22 - Presentation of Themes
4.1.2 Flood Theme
It is possible to use an alternative Flood theme based on the interpolation of 2D and 1D water levels. Refer to the Displaying Flood Extents on the GeoPlan topic for more information.
4.2 Graph and Grid Results
The change in depth, speed or direction (radians) with respect to time can be graphed or tabulated for any triangle using the  or
or  buttons.
4.3 2D Results Export
The change in depth, speed or direction (radians) with respect to time for any number of locations can be exported in .csv format.
They can also be exported to GIS. This is achieved by right clicking on the simulation icon, selecting Export from the context menu and selecting one of the following sub-options Maximum MIF..., Maximum SHP... or Maximun TAB.... This can be done for a maximum value and for a particular timestamp.
References:
1. Shewchuk, Jonathan Richard.
A Two-Dimensional Quality Mesh Generator and Delaunay Triangulator. Computer Science Division, University of California at Berkeley, Berkeley, California 94720-1776. http://www.cs.cmu.edu/~quake/triangle.html
2. Francisco Alcrudo, Pilar Garcia-Navarro.
A high-resolution Godunov-type scheme in finite volumes for the 2D shallow-water equations. Departmento de Ciencia y Technologia de Materiales y Fluidos, Facultad de Ciencias, Universidad de Zaragoza, Zaragoza 50009, Spain. Presented in International Journal for Numerical Methods in Fluids, Volume 16, Issue 6.
*********************
2d zone(s) summary
-----------------------------
2d Zone : Name of 2D zone
Area (ha) : 719.4717 Total area of 2D Zones (s)
Minimum element area (m2) : 25.00000 Defined by the user
Maximum element area (m2) : 100.0000 Defined by the user
Average element area (m2) : 14.32166 Average created during meshing External Boundary Condition : Vertical Walls Defined by user
Number of nodes : Number of vertices. Each triangle corner is a vertice
Number of elements : Total number of elements in the 2D zone
Number of faces : Each triangle length is a face. This is the total number of faces in the 2D zone.
Number of internal faces : Total number of triangle lengths that are not on a boundary but adjacent to another triangle.
Number of boundary faces : These are triangle lengths on boundaries including voids and the 2D mesh boundary.
Number of external boundary faces : These are the boundary faces on the 2D zone.
*********************
Virtual mesh summary
-----------------------------
2d Zone : Name of 2D Zone
Original number of elements : Total number of elements created for this 2D zone
Number of working elements : Number of elements in the virtual mesh for this 2D zone
Minimum element area (m2) : Minimum element area in the virtual mesh for this 2D zone
Maximum element area (m2) : Maximum element in the virtual mesh for this 2D zone meshing
Average element area (m2) : Average element area calculated during meshing for this 2D zone
Original number of faces : Total Number of faces for this 2D zone
Number of working faces : Number of faces in the virtual mesh for this 2D zone
*********************
Total number of original elements : Total number of elements for all 2D zones
Total number of working elements : Total number of working elements for all 2D zones
Total number of original faces : Total number of original faces for all 2D zones.
Total number of working faces : Total number of working faces for all 2D zones
Total 2d simulation time (s) : This is the 2D simulated runtime excluding writing to results.
*********************
Volume balance report
-------------------- --------
2d Zone Name : 2D
Initial Volume (m3) : Initial volume in the 2D zone
Net Inflow (m3) : Inflow - Outflow
Inflow (m3) : Inflow to the 2D zone
Total Volume in the surface (m3) : Total volume on the surface at the end of the simulation (Sum of volume in the 2d zone + volume out of the 2d zone)
Volume in the 2d zone (m3) : Total volume that has gone into the 2D zone
Volume out of the 2d zone (m3) : Total volume that has exited the 2D zone (Boundary type critical, supercritical or dry will cause a loss)
Mass error balance (%) : If the inflow into the 2D zone is greater than zero, then the error mass is calculated:(Net inflow - Total volume at the end of the simulation + Initial volume + Rain volume - Lost volume) / (the first non-zero value returned from either Initial volume, Inflow from 1D or Inflow from external boundaries) * 100. If the inflow is zero, then the calculation is based on the initial volume:(Initial Volume + Net inflow - total volume at the end of the simulation) / initial volume * 100
Area (ha) : Total area of 2D zone
Flooded area at the end of the simulation (ha) : Area of flooded elements at the end of the simulation
Maximum flooded area (ha) : Maximum flooded area
Net inflow in 1d nodes
Node id : 10_010 // Net Inflow (m3) : 0.0000
Node id : 10_020 // Net Inflow (m3) : 0.0000

*********************
Mass error report
-------------------- --------
2d Zone Name : 2D
Mass error (m3) : This is the mass error in m3 for this 2D zone
*********************
Total mass error (m3) : This is the mass error in m3 for all of the 2D zones
*********************
Filter index report-----------------------------
2d Zone Name : 2D Name of the 2D zone
Filter index : 0.0001 Percentage of cells exceding the maximum velocity
Memory used by simulation engine = 395.3Mb
EXITING
Article © Innovyze 2013