About fire flow availability results
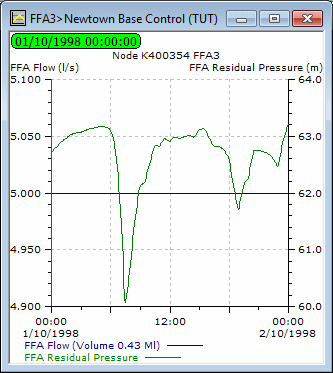
You can view the results of fire flow availability simulations on the results version of the Node grid view in the Nodes grid or as a graph of availability at an individual node.
Graphs for individual nodes
To view a graph at an individual node, follow the instructions for Graphing data for a network object.
There are two additional results fields when viewing fire flow simulation results:
- FFA Flow - The maintained fire flow.
- FFA Residual Pressure - The residual pressure after the fire flow is taken into account.
You can also view
the same results on a grid. ![]() Show image
Show image
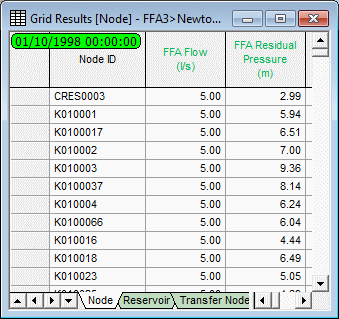
Node results grids
You can view results on grid views while replaying a simulation.
The Node grid view
in the Nodes grid includes
the FFA Flow and FFA
Residual Pressure results fields. These are time varying fields
and you can see the values changing during the replay. ![]() Show image
Show image
Other results
You can use the results on labels functionality to view the time varying fire flow results for individual nodes while viewing a replay on the GeoPlan window.
You can also view a snapshot of the time varying results for a single node on the node property sheet. See About results on property sheets.
Results at customer points
All customer points in the network have a FFA Residual Pressure results field. You can create a graph for an individual customer point as described above.


