GeoPlan Properties - Visual Page
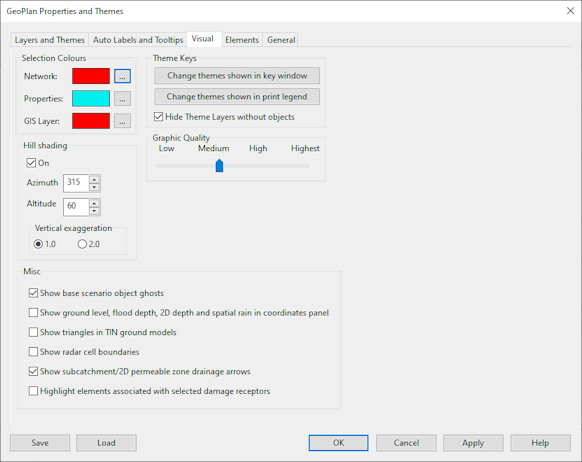
This page of the GeoPlan Properties dialog controls visual effects on the GeoPlan Window such as selection colour, hill shading settings, theme keys and theme graphic quality.
This section is used to change the selection colour of objects displayed in the GeoPlan Window:
- Click Ellipse (
 ) and choose the new selection colour from the Windows
Colour Picker dialog.
 - Click OK to save the new colour.
- Click OK again to close the dialog. This will set the selection colour to your new choice.
The selection colours that can be changed are:
- Network - selection colour is used to highlight all selected objects in network views.
- Properties - selection colour is used to highlight objects for which properties are viewed in the Object Properties Window. When the properties for a network objects are displayed in the Object Properties Window, (either via the window itself or by use of the properties
 tool), the object will be momentarily highlighted using this colour.
 - GIS Layer - selection colour is used to highlight objects found using the GIS Find or Street Find tool via the GeoPlan Find dialog.
You can use hill shading to emphasise the contours of a ground model displayed on the GeoPlan Window. Hill shading simulates a light source (the sun) which you can point towards your model from any:
- Direction around the horizon.
- Angle between horizontal (0°) and directly overhead (90°).
You can also exaggerate the vertical scale to make contours stand out more clearly.
- Use the On check box to switch hill shading on and off.
- Set the horizontal angle in the Azimuth box. 0° means the light source is pointing from the top of the view.
- Set the vertical angle in the Altitude box. 90° is directly overhead.
- Set the Vertical Exaggeration to give the best effect.
The best effects from hill shading need to be found by trial and error, and will vary depending on the ground model.
The options in the miscellaneous section are as follows:
- Check Show base scenario object ghosts to turn on the display of objects present in the base network but not in the current scenario.
- Check Show ground level, flood depth, 2D depth and spatial rain in coordinates panel to display the following values on the Status Bar:
- Ground level - when there is a Ground Model loaded in the GeoPlan. See Displaying Ground Model Height on the GeoPlan.
- Flood depths - when simulation results and a Ground Model are loaded in the GeoPlan.
- 2D depth - when simulation results are loaded in the GeoPlan.
- Spatial rain - when a Spatial Time Series Database is loaded in the GeoPlan.
The format in the panel is X, Y, G, F, D, R, where:
X, Y correspond to the GeoPlan X,Y coordinates at the current point
G is the ground model level at the current point
F is the flood depth at the current point
D is the 2D depth at the current point
R is the spatial rain at the current point

For points in the GeoPlan where a given level/height is undefined, a '-' is displayed in its place in the Coordinates Panel.
- Check Show triangles in TIN ground models to display the outlines of the underlying triangles that make up a TIN ground model.
-
Check the Show subcatchment/2D permeable zone drainage arrows to turn on the display of arrows on the GeoPlan View showing the drainage nodes for subcatchments and permeable zones. The arrows are drawn from the centroids of the subcatchment and permeable zone to the drainage nodes. The colours used for the lines are the same as the colours used to draw the subcatchment and the permeable zone polygons. If the node is at the centroid of the subcatchment or permeable zone, no line will be visible.
- The Show radar cell boundaries option turns on / off the display of radar cell boundaries. This option should be enabled if you are using spatial time series databases.
- Check Highlight elements associated with selected damage receptors to turn on highlighting of 2D mesh elements associated with a Damage Receptor, when the Damage Receptor is selected.
This section allows users to fine tune theme visibility on the GeoPlan, Thematic Key Window and on printouts.
Hide Theme Layers without objects: when checked, indicates that if no object of a particular type exists in the network, the legend for it (of the type symbol - object type) will be hidden in the Thematic Key and printed legend.
Both the Change themes shown in key window and the Change themes shown in print legend buttons allow you to specify en masse which of the layer themes are to be respectively shown in the Thematic Key window and the printed legend.
This slider governs the switching between two different types of Microsoft Graphics Device Interface, GDI and GDI+ (see Options - General Page for other GDI+ settings) which are responsible for representing graphical objects and transmitting them to output devices such as monitors and printers. Compared to GDI, which draws faster, GDI+ takes longer to draw but it has the advantage of supporting anti-aliasing, transparency, gradient shading and modern graphics file formats.
The switch is based on the number of objects to be drawn and the slider adjusts the threshold. Middle values for the slider should be preferred as these represent a trade-off between speed and graphic quality.
Note that in GDI mode, lines or symbols with very low visibility will not be drawn. For large networks, when displaying themes that use a range of visibility settings, set the Graphic Quality to a higher setting to view transparency effects (may affect drawing speed).

