Graph Data dialog
This dialog is used to define the data that is displayed on a saved graph. The dialog can be used to:
- set up a new saved graph
- alter the data displayed on a previous saved graph
- create a new saved graph based on a previous saved graph
The dialog is displayed when:
- you open a saved graph from the Model Group window or Explorer window
- you right-click an open saved graph and choose Graph data
The dialog comprises the following:
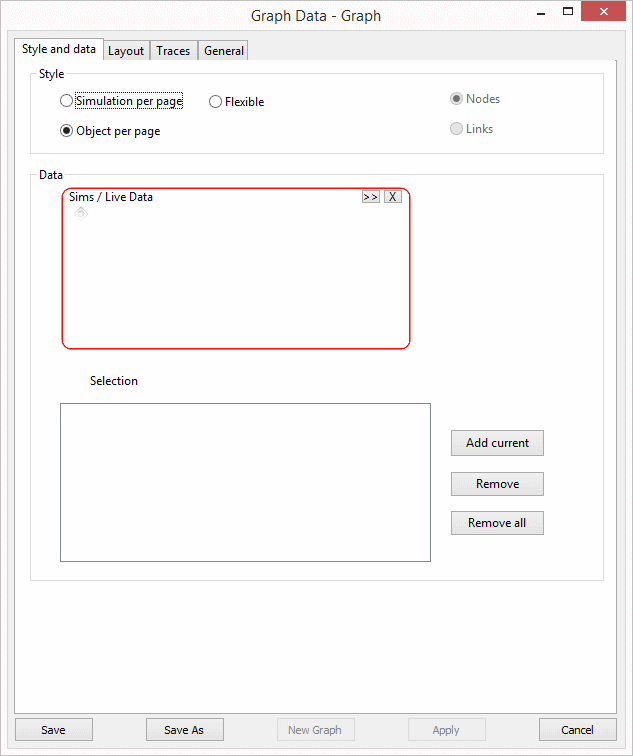
- Style and Data page - defines where the data comes from and how it is laid out on the page
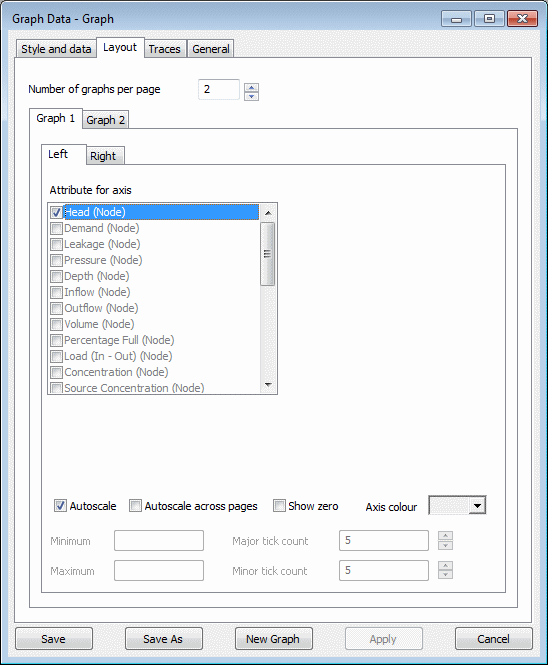
- Layout page - defines the individual parameters to be plotted and the scaling options to be used
- Traces page - defines the style for each trace on the graph via the Trace Style dialog.
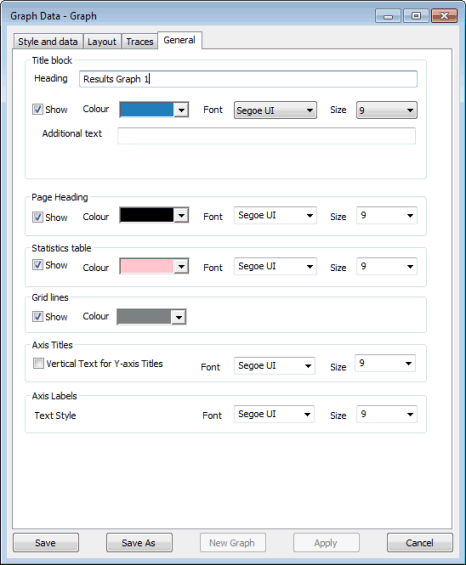
- General page - controls the display of grid lines on the graphs, additional text information at the top and bottom of the page and display of live data flags.
- Common controls - for creating the graph specified on the pages.
This page is used to define the source of the data to be displayed and how the graphed data is divided onto different pages.
| Item | Description | ||||||||||
|---|---|---|---|---|---|---|---|---|---|---|---|
| Style |
There are three options for the way the data is displayed on the finished graph.
You can scan through different pages on the graph using the arrow buttons in the top right corner of the Graph view. |
||||||||||
| Data |
This section lets you define the sources of data displayed on the graphs.
|
This page is used to set the parameters to plot on the Graph view.
The number of graphs to be plotted per page is defined on this page. Each graph can display object parameters utilising both left and right axes.
The format of the Layout page will vary with the style of graph selected from the Style and Data page.
Simulation per page and Object per page styles
| Item | Description | ||||||||||||||||
|---|---|---|---|---|---|---|---|---|---|---|---|---|---|---|---|---|---|
| Number of graphs per page | Set the number of graphs to be plotted per page. A tab for each graph will be displayed from which attributes to be plotted can be defined. | ||||||||||||||||
| Graph attribute options |
For each graph there is a tab for both the left axis and the right axis, from which the attributes to be plotted against each axis can be defined.
|
||||||||||||||||
| Scaling options |
|
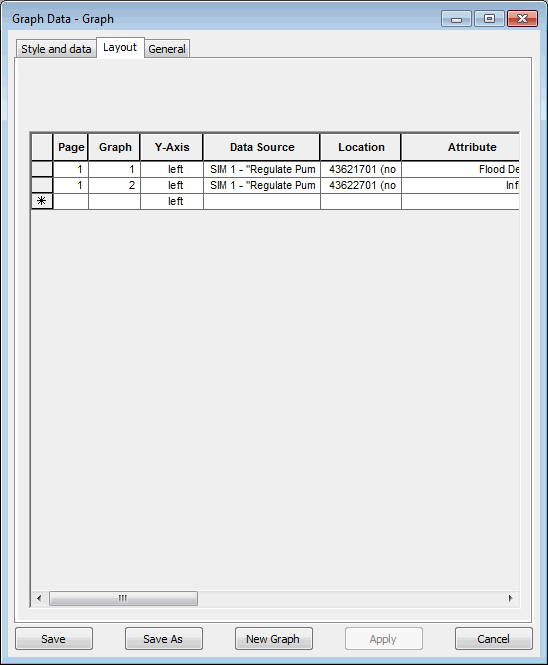
Flexible style
When creating graphs in Flexible mode, a grid view is displayed on the Layout page.
Flexible mode can be used to plot graphs from live data and simulation results. Multiple graphs can be plotted per page, and trace styles and scaling options can be set.
Validation is carried out in the grid so that if data has been entered that cannot be plotted (for example an entry has been added with no location information), the invalid cell will be highlighted red in the grid.
| Option | Description |
|---|---|
|
Page |
Number of the page that the graph is to be displayed on. |
|
Graph |
Number of the graph to be displayed on the defined page. |
|
Axis |
Axis on which the data is to be plotted. |
|
Data Source |
Dropdown list of live data and simulations selected in the Data section of the Style and Data page. |
|
Location |
Dropdown list of time varying data profiles and network objects selected in the Data section of the Style and Data page. |
|
Attribute |
Dropdown list of attributes that can be graphed for the selected Data Source and Location. |
|
Units |
Read only cell. Displays the type of units of the attribute to be graphed. |
|
Trace Style |
You can click in the Trace Style cell to display the Trace Style dialog. |
|
Axis Autoscale |
You can check the Axis Autoscale box to adjust the scale of the axis to display the full trace at the largest possible scale. |
|
Show zero |
You can check the Show zero box to include the zero line of the current axis. |
|
Axis colour |
You can select a colour from the dropdown palette for the current axis. |
|
Axis Minimum |
You can enter the minimum value to be graphed for the current axis. |
|
Axis Maximum |
You can enter the maximum value to be graphed for the current axis. |
|
Major Tick Count |
Used to adjust the number of horizontal grid lines to be displayed on the graph. |
|
Minor Tick Count |
Used to adjust the number of tick marks between horizontal grid lines. |
This page is used to define the style for each trace on the graph, using the Trace Style dialog. You open the Trace Style dialog by double-clicking a trace.
Note: This page is not available when using Flexible mode (that is, when the Style option on the Style And Data page has been set to Flexible). In Flexible mode, trace styles are edited from the grid on the Layout page.
- control the display of the title area at the top of the graph
- control the display of the page heading
- control the display of the statistics table area at the bottom of the graph
- control the display of gridlines on the graph plot
- control the display of the axes titles on the graph plot
- control the display of the axes labels on the graph plot
- control the display of live data flags on the graph
| Item | Description | ||||||||||
|---|---|---|---|---|---|---|---|---|---|---|---|
| Title Block |
|
||||||||||
| Page Heading |
|
||||||||||
| Statistics Table |
|
||||||||||
| Grid Lines |
|
||||||||||
| Axis Titles |
|
||||||||||
| Axis Labels |
|
||||||||||
| Flag Bars |
|
| Item | Description |
|---|---|
| Save | Saves the graph data. |
| Save As | Opens the Save As dialog, for saving the graph data as a new graph object. |
| New Graph | Generates a graph from the data input for this graph object. |
| Apply | Applies changes made to the graph data. |
| Cancel | Closes the dialog without saving any changes or generating a new graph. |


